Figures & data
Table 1. Blood serum cholesterol levels of the rats selected for cDNA microarray analysis.
Figure 1. Sources of variation: average sum of squares, analysis of variation (p < 0.05). The variation source is profoundly diet type (treatment).
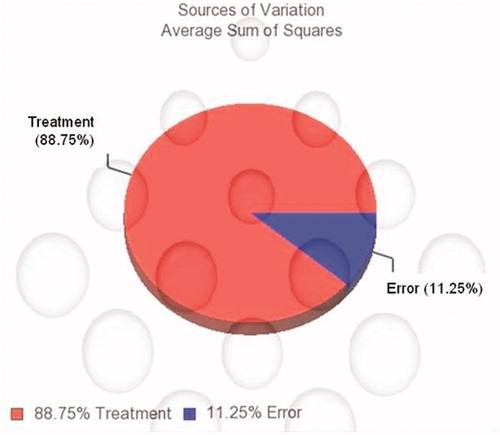
Table 2. The gene list that represents the fold change of genes encoding lipid/cholesterol metabolism related proteins in rat livers.
Figure 2. Adh7 enzyme in KEGG pathway: fatty acid metabolism (http://www.genome.jp/ kegg-bin/show_pathway?map00071+M00086).
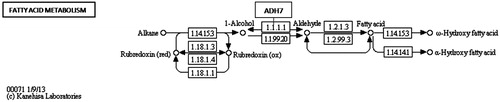
Figure 3. Hmgcs1 enzyme in KEGG pathway: synthesis and degradation of ketone bodies (http://www.genome.jp/kegg-bin/show_pathway?ko00072+K00626).
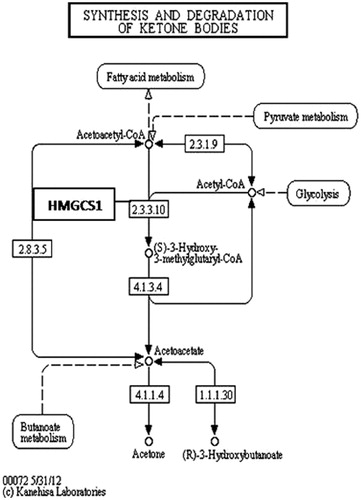
Figure 4. Cyp39a1, acox1 and baat enzymes in KEGG pathway: primary bile acid biosynthesis (http://www.genome.jp/kegg-bin/show_pathway?ko00120+K00489).
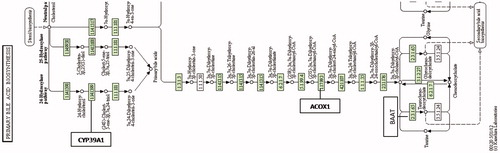
Figure 5. Fabp1 enzyme in KEGG pathway: PPAR signaling pathway (http://www.genome.jp/kegg-bin/show_pathway?ko03320+K00489).
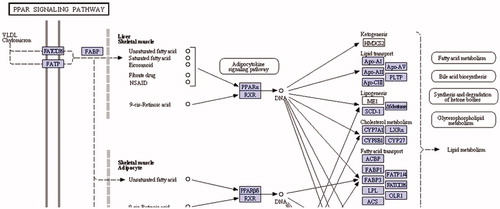
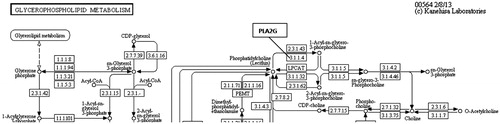
Figure 6. Pla2g enzyme in KEGG pathway: glycerophospholipid metabolism (http://www.genome.jp/kegg-bin/show_pathway?map00564).