Figures & data
Figure 1. Effect of AEBM on renal lipid status of HCD-induced hypercholesterolemia in control and experimental rats. Values were expressed as mean ± S.D. for six rats in each group. Statistical significance (p value): **p < 0.01, (a) compared with the control group, (b) compared with the HCD group.
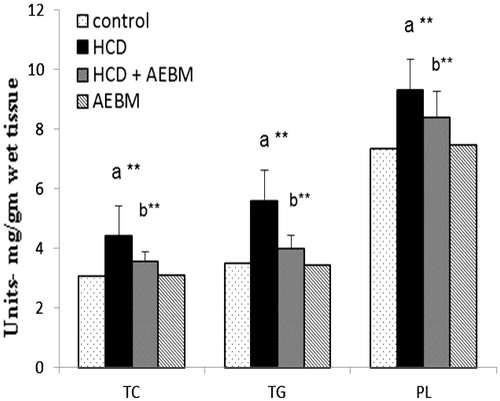
Table 1. Effect of AEBM on the activities of renal enzymic antioxidant of HCD-induced hypercholesterolemia in control and experimental rats.
Table 2. Effect of AEBM on the activities of renal non-enzymic antioxidant of HCD-induced hypercholesterolemia in control and experimental rats.
Figure 2. Effect of AEBM on the levels in renal LPO of HCD-induced hypercholesterolemia in control and experimental rats. Values were expressed as mean ± S.D. for six rats in each group. Statistical significance (p value): *p < 0.05, **p < 0.01, (a) compared with the control group, (b) compared with the HCD group.
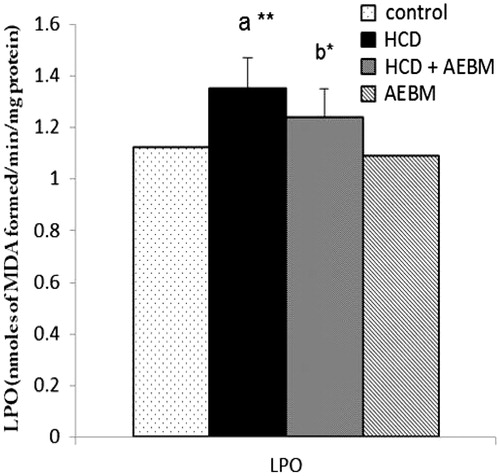
Table 3. Effect of AEBM on the levels of urea, creatinine, and uric acid (renal markers) in serum of HCD-induced hypercholesterolemia in control and experimental rats.
Figure 3. Effect of AEBM on mRNA expression levels of eNOS in renal artery of control and experimental rats. Lane 1 represents the DNA marker; lane 2 represents the control group; lane 3 represents the HCD group; lane 4 represents the HCD + AEBM treatment group; lane 5 represents the AEBM alone group. Densitometric analysis of the bands is expressed as net intensity ratio corrected for the corresponding β-actin contents. Values were expressed as mean ± S.D. for six rats in each group. Statistical significance (p value): *p < 0.05, **p < 0.01, (a) compared with the control group, (b) compared with the HCD group.
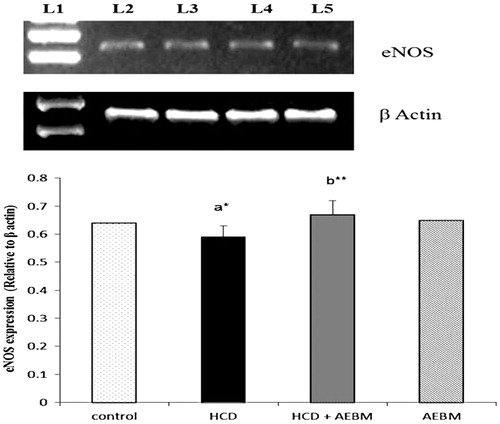
Figure 4. Effect of AEBM on mRNA expression levels of iNOS in renal artery of control and experimental rats. Lane 1 represents the DNA marker; lane 2 represents the control group; lane 3 represents the HCD group; lane 4 represents the HCD + AEBM treatment group; lane 5 represents the AEBM alone group. Densitometric analysis of the bands is expressed as net intensity ratio corrected for the corresponding β-actin contents. Values were expressed as mean ± S.D. for six rats in each group. Statistical significance (p value): **p < 0.01, (a) compared with the control group, (b) compared with the HCD group.
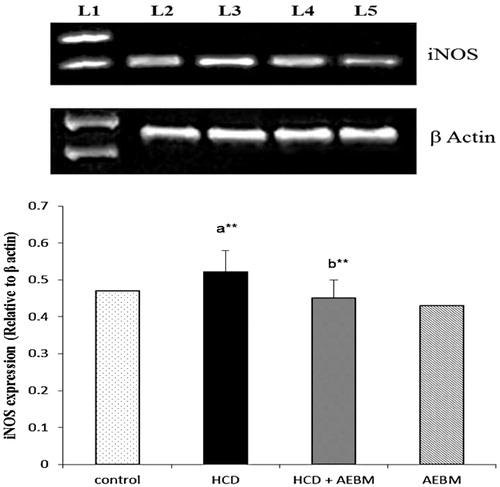
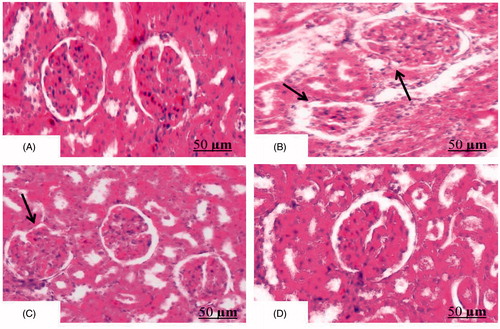
Figure 5. Effect of AEBM on histopathological changes in renal tissue of HCD-induced hypercholesterolemia in control and experimental rats. Transection of renal tissue (control) showed normal architecture of glomeruli and tubules of nephron (H&E, 100×) (). Transection of HCD-induced rats depict swelling of renal tubules and tubular epithelial denudation with casts in the widened lumens (glomerular hypertrophy) of renal tissue (). Transection of AEBM + HCD rats showed mild tubular epithelial damage when compared with HCD rats (), when compared with HCD rats. AEBM alone ()-treated rats showed normal renal architecture similar to that of control rats (H&E, 100×) (scale bar: 50 µm).