Figures & data
Figure 1. The effect of E. microsciadia (A), E. heteradenia (B), and E. osyridea (C) extracts on the proliferation of the lymphocytes in the presence (1) and absence (2) of phytohemagglutinin (PHA). Peripheral blood lymphocytes were treated with various concentrations of the extracts for 48 h and then the cell proliferation was measured by Brdu incorporation assay. The positive control (c+) was lymphocytes treated only with PHA and without the extracts and the negative control (c−) was those without PHA and the extracts. The asterisks on the graphs show significant difference with the positive control (for cultures in the presence of PHA; A1, B1, C1) and with the negative control (for cultures in the absence of PHA; A2, B2, C2). *p < 0.05, **p < 0.01. The experiments were performed in triplicates and repeated at least three times.
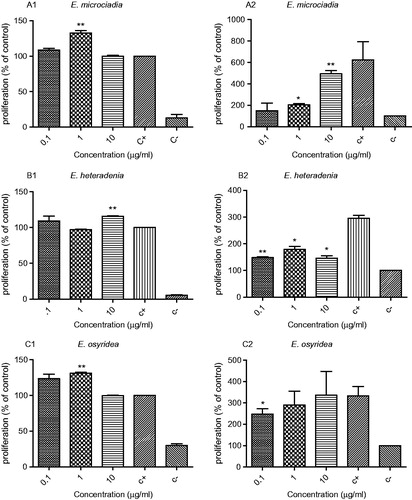
Figure 2. The effect of plant extracts on the production of IL-4 (A), IFN-γ (B), IL-17 (C), and IL-10 (D) by the lymphocytes in the presence of PHA. Peripheral blood lymphocytes were treated with 1 or 10 µg/ml of the extracts for 48 h and then the supernatants were collected for cytokine measurement by ELISA assay. The positive control (c+) was lymphocytes stimulated with PHA and without extract and the negative control (c−) was without PHA and extract. The asterisks on the graphs show significant difference with the positive control. *p < 0.05, **p < 0.01, ***p < 0.001. The experiments were performed in triplicate and repeated at least three times.
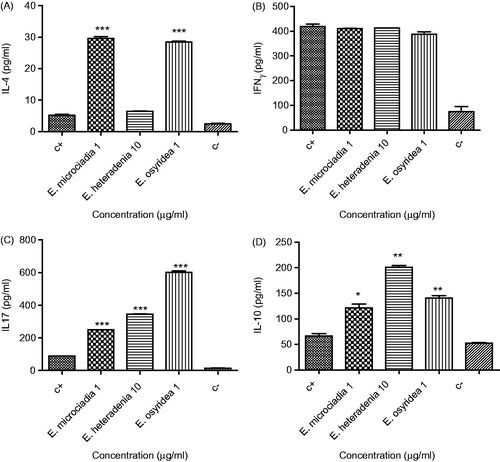
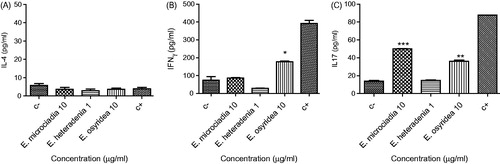
Figure 3. The effect of plant extracts on the production of IL-4 (A), IFN-γ (B), and IL-17 (C) by lymphocytes in the absence of PHA. Peripheral blood lymphocytes were treated with 1 or 10 µg/ml of the extracts for 48 h and then the supernatants were collected for cytokine measurement by ELISA assay. The positive control (c+) was lymphocytes stimulated with PHA and without extract and the negative control (c−) was without PHA and extract. The asterisks on the graphs show significant difference with the negative control. *p < 0.05, **p < 0.01, ***p < 0.001. The experiments were performed in triplicate and repeated at least three times.