Figures & data
Table 1. Oligonucleotide primer sequences.
Figure 1. Cytotoxicity of parthenolide against MCF-7 and SiHa cells evaluated by MTT and LDH assays.
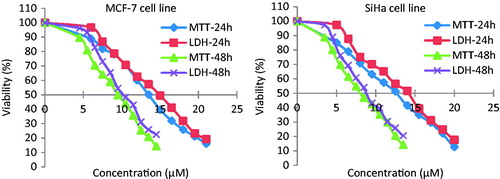
Figure 2. Expression of Bax, p53, and Bcl-2 genes in parthenolide-treated SiHa cells. Densitometry analysis revealed the relative band intensity (p ≤ 0.0013). (A) Bax, (B) p53, and (C) Bcl-2.
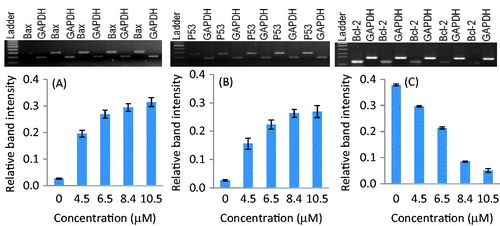
Figure 3. Expression of Bax, p53, and Bcl-2 genes in parthenolide-treated MCF-7 cells. Densitometry analysis revealed the relative band intensity (p ≤ 0.0060). (A) Bax, (B) p53, and (C) Bcl-2.
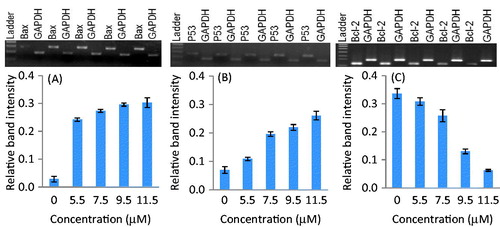
Figure 4. Up-regulation of caspase-3, -6, and -9 genes in parthenolide-treated SiHa cells. Densitometry analysis revealed the relative band intensity (p ≤ 0.0013). (A) Caspase-3, (B) caspase-6, and (C) caspase-9.
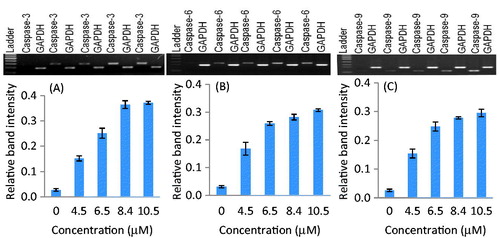
Figure 5. Up-regulation of caspase-3, -6, and -9 genes in parthenolide-treated MCF-7 cells. Densitometry analysis revealed the relative band intensity (p ≤ 0.0081). (A) Caspase-3, (B) caspase-6, and (C) caspase-9.
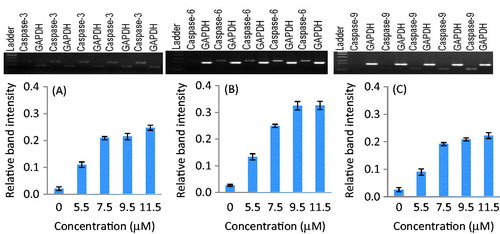
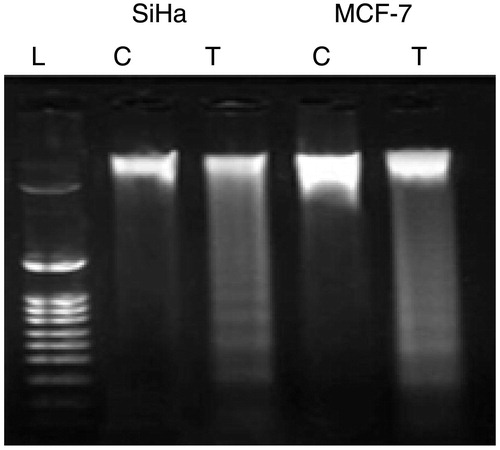
Figure 6. Fragmentation of genomic DNA in parthenolide-treated SiHa and MCF-7 cells. T, test; C, control.