Figures & data
Table 1. Concentration of toxicity expressed in mouse units per 100 g tissue and microgrammes per kg tissue, estimated in fish organs of S. salpa collected from the Island of Kerkennah (Gulf of Gabes; South East Tunisia) during autumn (2008–2010).
Table 2. Effects of tissue extracts of flesh, liver, brain, and viscera of S. salpa (0.3 mL/100 g, v/w) on body and cerebral cortex weights of control and treated rats after 7 d of treatment.
Figure 1. Effects of tissue extracts of flesh, brain, liver, and viscera of S. salpa (0.3 mL/100 g, v/w) on the cerebral cortex TBARS level of treated rats versus control rats. FT, flesh-treated group; BT, brain-treated group; LT, liver-treated group; VT, viscera-treated group. FT-, BT-, LT-, and VT-treated groups compared with the control group: *p < 0.05. FT and BT groups compared with LT and VT: #p < 0.05.
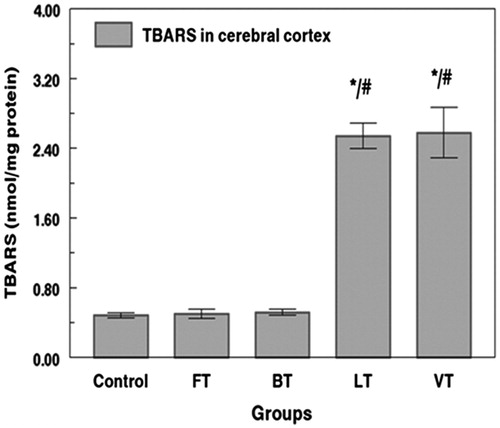
Table 3. Effects of tissue extracts of flesh, brain, liver, and viscera of S. salpa (0.3 mL/100g, v/w) on the cerebral cortex SOD, CAT, and GPx activities of treated rats versus control group.
Figure 2. Effects of tissue extracts of flesh, brain, liver, and viscera of S. salpa (0.3 mL/100 g, v/w) on the cerebral cortex AchE activity of treated rats versus control rats. FT, flesh-treated group; BT, brain-treated group; LT, liver-treated group; VT, viscera-treated group. FT-, BT-, LT- and VT-treated groups compared with the control group: *p < 0.05. FT and BT groups compared with LT and VT: #p < 0.05.
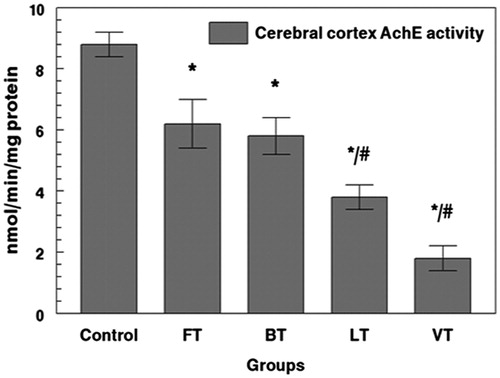
Figure 3. Effects of tissue extracts of flesh, brain, liver, and viscera of S. salpa (0.3 mL/100 g, v/w) on the plasma AchE activity of treated rats versus control rats. FT, flesh-treated group; BT, brain-treated group; LT, liver-treated group; VT, viscera-treated group. FT-, BT-, LT-, and VT-treated groups compared with the control group: *p < 0.05. FT and BT groups compared with LT and VT: #p < 0.05.
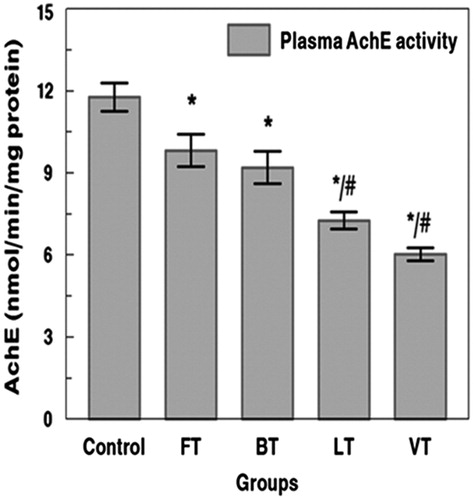
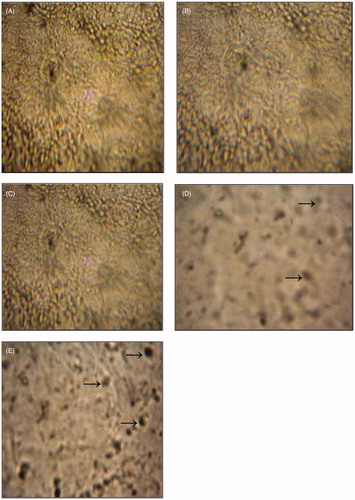
Figure 4. Photomicrographs showing histological changes in cerebral cortex in different groups; control group (A); flesh- and brain-treated groups (B); (C) and liver- and viscera-treated groups (D); (E) several abnormalities (indicated by arrows). (A) Histological picture showing normal cerebral cortex tissue. Hematoxylin and eosin staining, ×400. ![]()
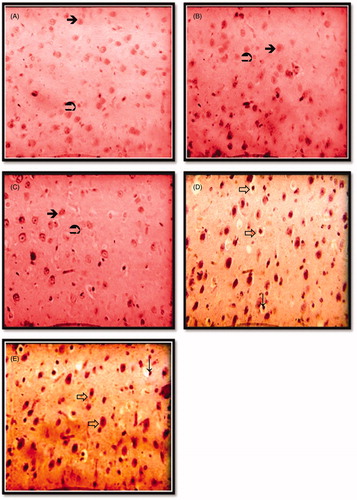
Figure 5. Photomicrographs of section of cerebral cortex in different groups; control group (A); flesh- and brain-treated groups (B) and (C) and liver- and viscera-treated groups (D) and (E) stained by TUNEL technique (magnification ×400). Cerebral cortex was fixed by direct immersion in a 4% paraformaldehyde in 0.1 M phosphate buffer. Serial sections (5 μm) were mounted on gelatin-coated glass slides cut and stained using the TUNEL technique (see section Materials and methods). →Apoptotic cells (arrows).