Figures & data
Figure 1. Western blot analysis of NF-κB expression, expressed as percentage in relation to control, in vascular smooth muscle cells (VSMCs) from non-diabetic rats (panel A) and Goto–Kakisaki (GK) rats (panel B). We performed immunoblotting to compare the protein content of NF-κB in VSMCs stimulated by AGE-BSA at the concentrations indicated. Values represent the NF-κB/β-actin ratio. Data are expressed as mean ± SEM of three independent experiments per group, each performed in quadruplicate. *p < 0.05 versus bar one (one-way ANOVA followed by Bonferroni's test).
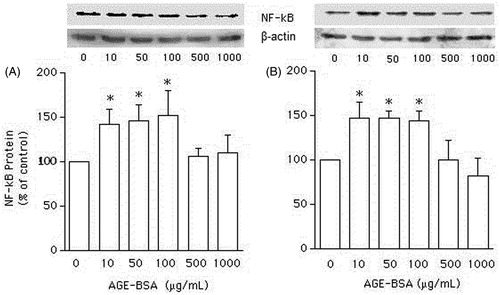
Figure 2. NF-κB expression in vascular smooth muscle cells (VSMCs) from non-diabetic (W) rats (panel A) and Goto–Kakisaki (GK) rats (panel B) stimulated by AGEs-BSA in the presence or absence of apocynin. The influence of AGEs-BSA (100 μg/mL) on NF-κB expression, expressed as percentage in relation to control, in the presence of apocynin (1 and 10 µM) was investigated by Western blot analysis. Values represent the NF-κB/β-actin ratio. Data are shown as mean ± SEM of three independent experiments per group, each performed in quadruplicate. *p < 0.05 versus bar one (one-way ANOVA followed by Bonferroni's test), #p < 0.05 versus bar two (one-way ANOVA followed by Bonferroni's test).
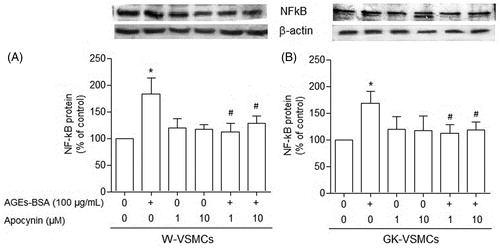
Figure 3. Western blot analysis of peroxisome proliferator-activated receptor gamma (PPARγ) expression, expressed as percentage in relation to control, in vascular smooth muscle cells (VSMCs) from non-diabetic rats (panel A) and Goto–Kakisaki (GK) rats (panel B). Immunoblot was performed to compare the protein content of PPARγ expression in VSMCs stimulated by AGEs-BSA at the concentrations indicated. Values represent the PPARγ/β-actin ratio. Data are expressed as mean ± SEM of three independent experiments per group, each performed in quadruplicate. *p < 0.05 versus bar one (one-way ANOVA followed by Bonferroni's test).
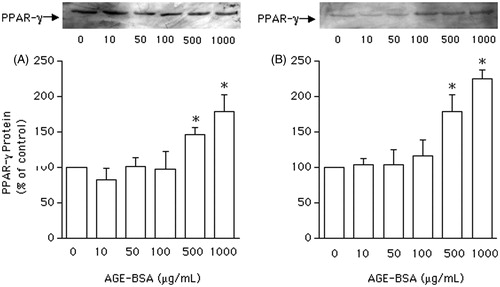
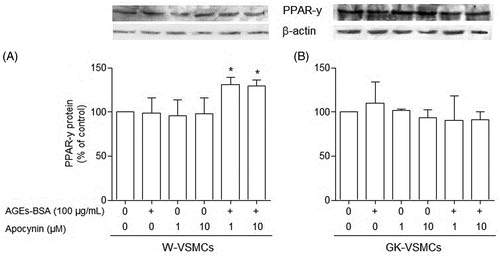
Figure 4. Peroxisome proliferator-activated receptor gamma (PPARγ) expression in vascular smooth muscle cells (VSMCs) from non-diabetic (W) rats (panel A) and Goto–Kakisaki (GK) rats (panel B) stimulated by AGEs-BSA in the presence or absence of apocynin. The influence of AGEs-BSA (100 μg/mL) on PPARγ expression, expressed as percentage in relation to control, in the presence of apocynin (1 and 10 µM) was investigated by Western blot analysis. Values represent the PPARγ/β-actin ratio. Data are shown as the mean ± SEM of three independent experiments per group, each performed in quadruplicate. *p < 0.05 versus bar two (one-way ANOVA followed by Bonferroni's test).