Figures & data
Table 1. Grouping of normoglyclemic mice for sub-acute (12 days) studies.
Figure 1. Effect of varying doses of 80% methanolic extract of I. gracilis on normoglycemic mice measured at different time intervals. Values are expressed as mean ± SEM (*p < 0.05, **p < 0.01, ***p < 0.001).
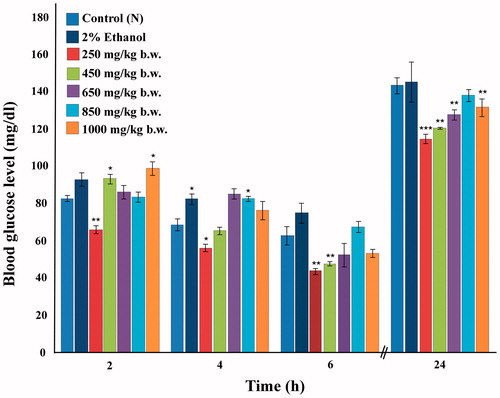
Figure 2. Effect of 80% methanolic extract of I. gracilis (250 mg/kg b.w.) on alloxan-induced diabetic mice measured at different time intervals. Values are expressed as mean ± SEM (*p < 0.05, **p < 0.01, ***p < 0.001).
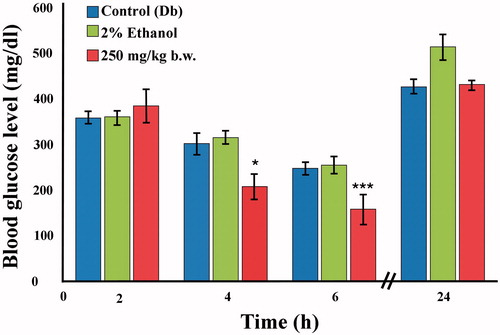
Figure 3. Glucose tolerance in normoglycemic mice administered with 250 mg/kg b.w. 80% methanolic extract of I. gracilis and reference drugs. Values are expressed as mean ± SEM.
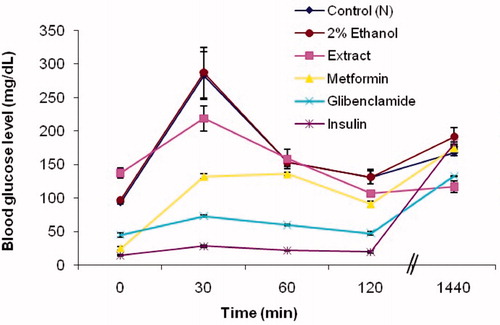
Figure 4. Glucose tolerance in alloxan-induced diabetic mice administered with 250 mg/kg b.w. About 80% methanolic extract of I. gracilis and reference drugs. Values are expressed as mean ± SEM.
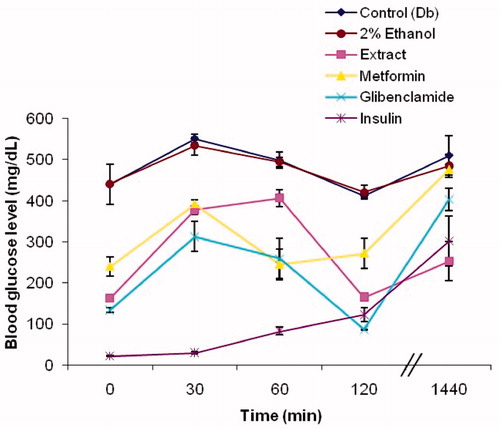
Table 2: Total polyphenol, flavonoid, protein and carbohydrate content, and DPPH radical scavenging activity of 80% methanolic extract of I. gracilis. Results are expressed as mean ± SEM.
Figure 5. Glutathione peroxidase (GPx) activity in various tissues (liver, kidney, and brain) of normoglycemic, diabetic, 2% ethanol-treated, extract-treated, and glibenclamide-treated diabetic mice compared against their respective controls: diabetic versus normoglycemic, values are expressed as mean ± SEM (#p < 0.05, ##p < 0.01, ###p < 0.001); 2% ethanol-treated, extract-treated, and glibenclamide-treated diabetic versus the diabetic control group, values are expressed as mean ± SEM (*p < 0.05, **p < 0.01, ***p < 0.001).
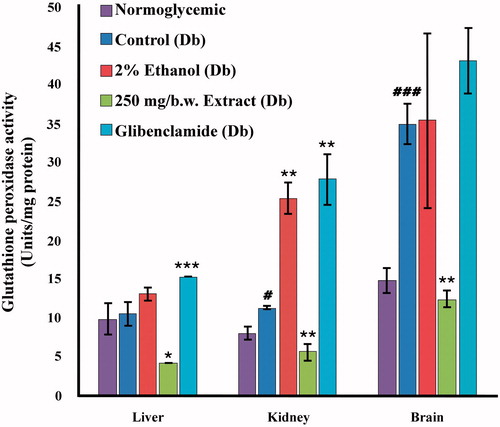
Figure 6. Superoxide dismutase (SOD) activity in various tissues of normoglycemic, diabetic, 2% ethanol-treated, extract-treated, and glibenclamide-treated diabetic mice compared against their respective controls: diabetic versus normoglycemic, values are expressed as mean ± SEM (#p < 0.05, ##p < 0.01, ###p < 0.001); 2% ethanol-treated, extract-treated, and glibenclamide-treated diabetic versus the diabetic control group, values are expressed as mean ± SEM (*p < 0.05, **p < 0.01, ***p < 0.001).
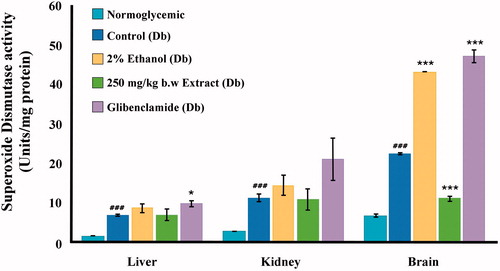
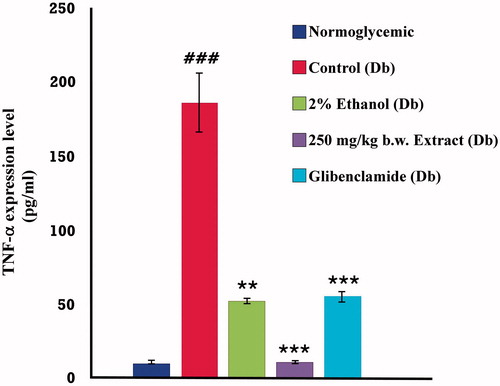
Figure 7. TNF-α expression level in normoglycemic, diabetic, 2% ethanol-treated, extract-treated, and glibenclamide-treated diabetic mice compared against their respective controls: diabetic versus normoglycemic, values are expressed as mean ± SEM (#p < 0.05, ##p < 0.01, ###p < 0.001); 2% ethanol-treated, extract-treated and glibenclamide-treated diabetic versus the diabetic control group, values are expressed as mean ± SEM (*p < 0.05, **p < 0.01, ***p < 0.001).