Figures & data
Figure 1. Chemical structure of mangiferin.
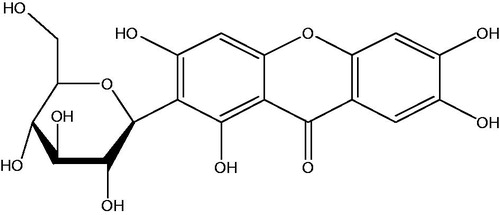
Figure 2. Mangiferin induced the nuclear accumulation of Nrf2 in MNC hUCB cells in confocal microscopy. (A) Cells were treated with 0, 12.5, 25, 50, 100, or 200 μM mangiferin for 4 h in dose–response studies or (B) incubated with 50 μM mangiferin for 0, 0.5, 1, 2, or 4 h, respectively, in time–response studies. Subcellular localization of Nrf2 was determined by confocal microscopy using FITC-conjugated Nrf2 antibody. The nuclei were visualized by Hoechst staining. Merging the Nrf2 and nuclei images confirmed the nuclear localization of Nrf2 (400 × magnification). Scale bars=10 μm.
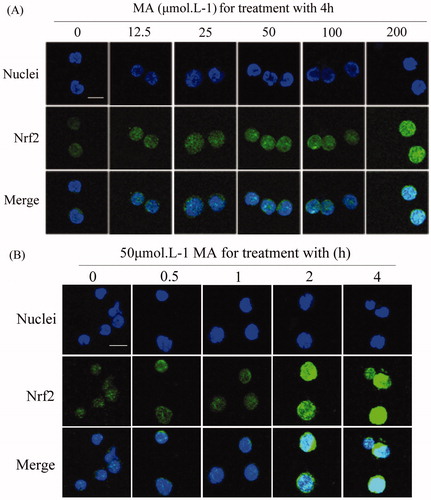
Figure 3. Mangiferin increased the nuclear accumulation of Nrf2 in MNC hUCB cells in western blotting. (A) Cells were treated with 50 μM mangiferin for 0, 0.5, or 2 h. Subcellular expression of Nrf2 was determined by western blotting. β-Actin or lamin B was examined as the control for equal protein loading and protein integrity. (B) Nrf2 expression determined by western blotting was quantified by densitometry. Data represented the mean ± SD of at least three independent experiments (*p < 0.05).
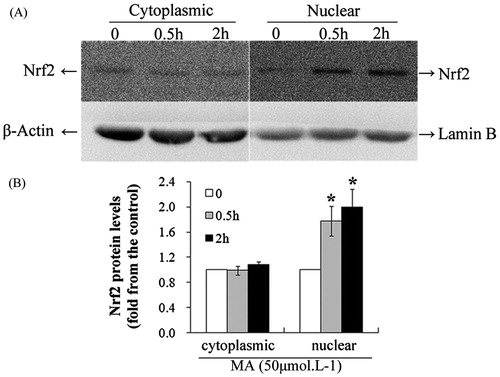
Figure 4. Effects of mangiferin on Nrf2-ARE binding in MNC hUCB cells. The interaction of Nrf2 with ARE was analyzed by EMSA. Lane 1, control cells without stress. Lane 2, cells were treated with 50 μM mangiferin for 4 h, then the nuclear extracts were incubated with biotin-labeled human NQO1-ARE probes. Lane 3 or 4, cells were treated with 50 μM mangiferin for 4 h, then the nuclear extracts were incubated with 170-fold or 340-fold excess of cold probes (unlabeled human NQO1-ARE probes). Lane 5, cells were treated with 50 μM mangiferin for 4 h, after that the nuclear extracts were pre-incubated with 0.4 μg Nrf2 antibodies and then incubated with biotin-labeled human NQO1-ARE probes. The arrow indicates the position of the ARE-Nrf2 complexes. *170-fold excess of cold probes and **340-fold excess of cold probes.
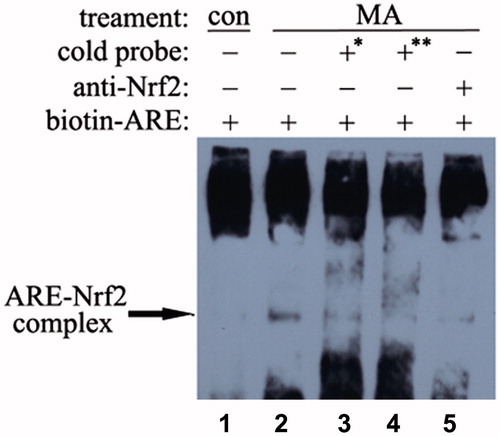
Figure 5. Effects of mangiferin on NQO1 expression in MNC hUCB cells. (A) After treating with 50 μM mangiferin for 0, 6, 12, 24, or 48 h, total cell lysates were subjected to western blotting with NQO1 antibodies. β-Actin was examined as the control for equal protein loading and protein integrity. (B) NQO1 expression was quantified by densitometry. Data represented the mean ± SD of at least three independent experiments (*p < 0.05).
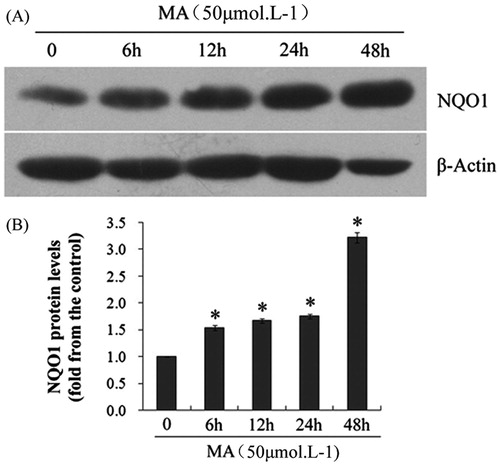
Figure 6. Mangiferin reduced etoposide-induced DNA damage in MNC hUCB cells in comet assay. (A) Typical comet images (400 × magnification). In etoposide treatment groups, cells were treated with 0, 1, 10, or 100 μg/ml etoposide for 2 h. In MA and etoposide combination treatment groups, cells were pre-incubated with 50 μM mangiferin for 4 h before etoposide treatment. (B) OTM values. (C) %DNA in tail values. Data represented the mean ± SD of at least three independent experiments. (*p < 0.05 compared with the group treating with same concentration of etoposide. #p < 0.05 compared with the nontreated control group).
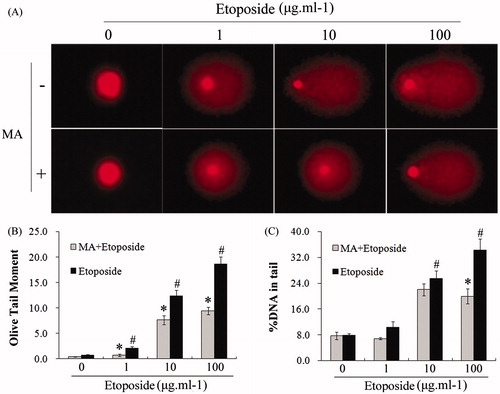
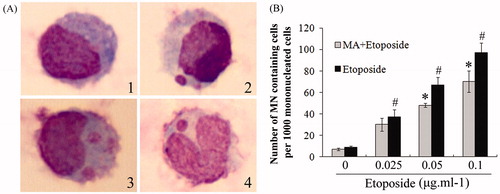
Figure 7. Mangiferin decreased etoposide-induced MN in MNC hUCB cells in MN assay. (A) Typical images (1000 × magnification): (1) normal mononucleated cell; (2) mononucleated cell containing one MN; (3) mononucleated cell containing two MNs; (4) “V” type rhabditiform nuclei cell containing one MN. (B) MN frequency in each group. In etoposide treatment groups, cells were treated with 0, 0.025, 0.05, or 0.1 μg/ml etoposide for 24 h. In MA and etoposide combination treatment groups, cells were pre-incubated with 50 μM mangiferin for 4 h before etoposide treatment. Data represented the mean ± SD of at least three independent experiments. (*p < 0.05 compared with the group treating with same concentration of etoposide. #p < 0.05 compared with the nontreated control group).