Figures & data
Table 1. Effect of treatment of APME on body weight, liver weight, and spleen weight in paracetamol-induced toxicity in rats.
Figure 1. Effect of treatment of APME on albumin (A), blood urea nitrogen (B), serum creatinine (C), and uric acid (D) in paracetamol-induced toxicity in rats. Data are expressed as mean ± SEM (n = 6) and analyzed by one-way ANOVA followed by Dunnett's test for each parameter separately. *p < 0.05, **p < 0.01, and ***p < 0.001 as compared with the APAP group and ##p < 0.01 and ###p < 0.001 as compared with the normal group.
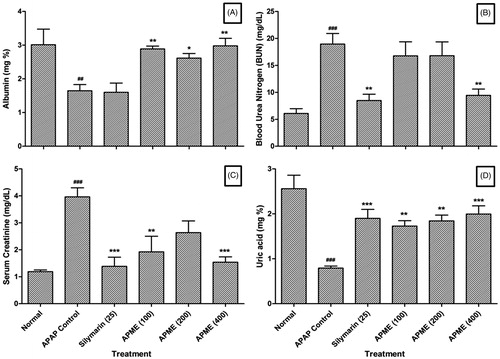
Table 2. Effect of treatment of APME on alkaline phosphatase, total bilirubin, direct bilirubin, SGOT, and SGPT in paracetamol-induced toxicity in rats.
Table 3. Effect of treatment of APME on cholesterol, HDL, LDL, LDH, triglyceride, and VLDL in paracetamol-induced toxicity in rats.
Figure 2. Effect of treatment of APME on hepatic and renal SOD (A), GSH (B), MDA (C), and NO (D) in paracetamol-induced toxicity in rats. Data are expressed as mean ± SEM (n = 6) and analyzed by a one-way ANOVA followed by Dunnett's test for each parameter separately. *p < 0.05, **p < 0.01, and ***p < 0.001 as compared with the APAP group and ##p < 0.01 and ###p < 0.001 as compared with normal group.
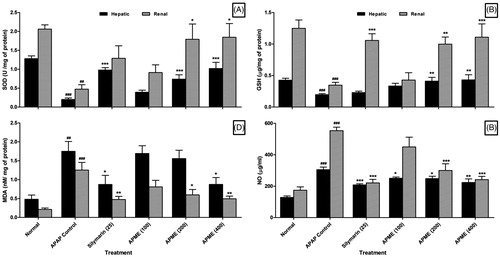
Figure 3. Effect of treatment of APME on paracetamol-induced pathological alteration in rat liver. Photomicrograph of sections of liver of normal (A), APAP (B), silymarin (25 mg/kg) treated (C), and APME (400 mg/kg) treated (D) rats. Inflammatory infiltration (black arrow), edema (yellow arrow), congestion (green arrow), and necrosis (red arrow). H&E staining at 40 × and 100 × (inset).
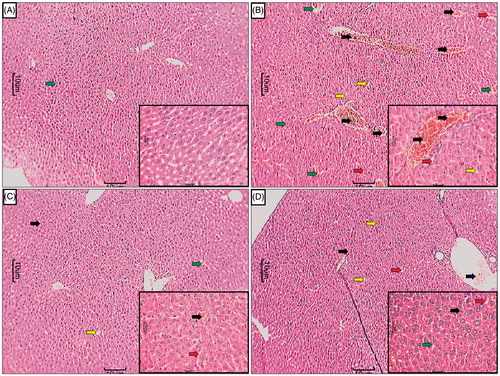
Table 4. Effect of treatment of APME on paracetamol-induced pathological alteration in rat liver.
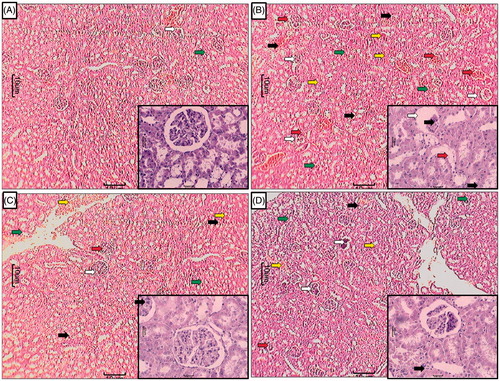
Figure 4. Effect of treatment of APME on paracetamol-induced pathological alteration in rat kidney. Photomicrograph of sections of kidney of normal (A), APAP (B), silymarin (25 mg/kg) treated (C), and APME (400 mg/kg) treated (D) rats. Glomerular hypertrophy (white arrow), inflammatory infiltration (black arrow), edema (yellow arrow), congestion (green arrow), and necrosis (red arrow). H&E staining at 40 × and 100 × (inset).