Figures & data
Figure 1. The effects of arctigenin on the cell viability of RAFLSs. RAFLSs (1 × 10⁴) were seeded into 96-well plates. Cells were cultured in the presence or absence of arctigenin (0–160 μM) for 48 h (A) and (B) or in the presence or absence of arctigenin (0–30 μM) for 0, 12, 24, and 48 h (C). The cell viability was measured by the MTT assay. Arctigenin-induced cytotoxicity was assessed by LDH assay. Data are shown as mean ± SD (n = 3) from three independent experiments. *p < 0.05, **p < 0.01, relative to control RAFLSs.
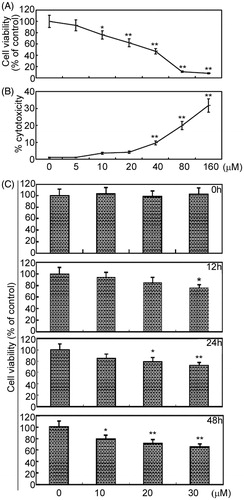
Figure 2. Arctigenin induces RAFLS apoptosis. RAFLSs were treated with various concentrations of arctigenin (0–30 μM) for 48 h and examined by annexin V/ propidium iodide (PI) double staining. Apoptosis was analyzed using flow cytometry. Apoptotic cells were annexin V-positive and PI-negative cells (lower right quadrant). (A) Representative flow cytometry results for RAFLSs exposed to arctigenin (0–30 μM) for 48 h. (B) The histogram shows the apoptosis ratio (%) of RAFLSs. The data represent three independent experiments. *p < 0.05, **p < 0.01, relative to control RAFLSs.
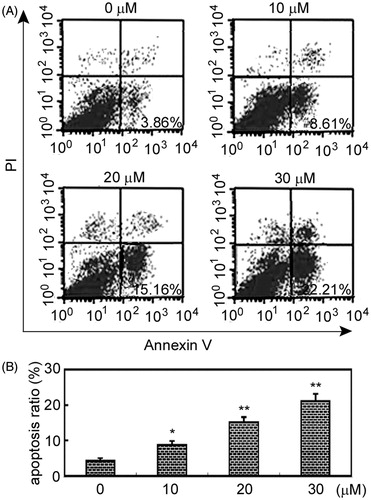
Figure 3. Arctigenin induces mitochondrial apoptosis of RAFLSs. (A) Cells were treated with indicated concentrations of arctigenin (0–30 μM) for 48 h and stained with JC-1. The mean JC-1 fluorescence intensity was detected by FACS analysis. Images are representative of three independent experiments (upper panel). Quantification of FACS analysis is shown in the lower panel. (B)–(D) Cells were treated with indicated concentrations of arctigenin (0–30 μM) for 48 h and subjected to Western blot analysis. Data are shown as mean ± SD (n = 3) from three independent experiments. *p < 0.05, **p < 0.01, relative to control RAFLSs.
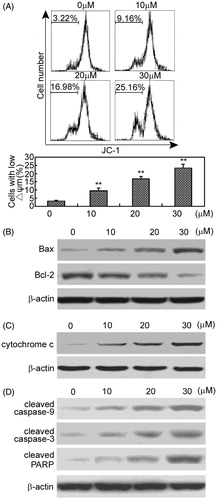
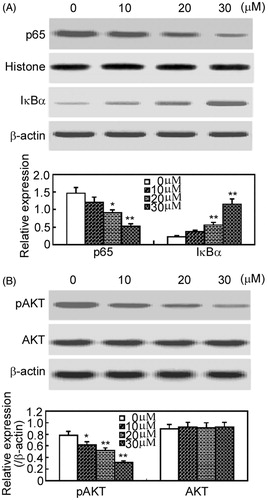
Figure 4. Arctigenin inhibits NF-κB and Akt signaling pathways in RAFLSs. RAFLSs were treated with the indicated concentrations of arctigenin (0–30 μM) for 48 h and subjected to Western blot analysis. The nuclear translocation of p65 and the degradation of IκBα (A) and the phosphorylation of Akt (B) are shown in the upper panel. Quantification of Western blot analysis is shown in the lower panel. Data are shown as mean ± SD (n = 3) from three independent experiments. *p < 0.05, **p < 0.01, relative to control RAFLSs.