Figures & data
Figure 1. Structure of MLB. Molecular formula: C38H28MgO16; molecular weight: 740.90. MLB, magnesium lithospermate B.
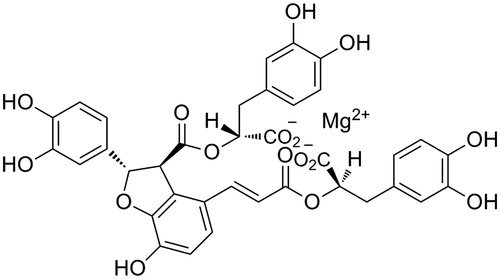
Figure 2. Study design. Experimental groups and protocols for the antidepressant-like effects by MLB in rats. MLB, magnesium lithospermate B; CUS, chronic unpredictable stress.
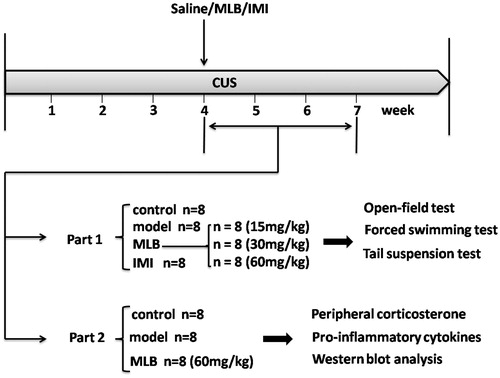
Table 1. Schedule of chronic mild stress procedures.
Figure 3. Effects of CUS in rats and antidepressant-like effects of MLB in rats during the OFT. MLB, magnesium lithospermate B; OFT, open-field test. Values are expressed as the mean ± S.D. n = 8. Significance was determined by ANOVA followed by Tukey’s test. #p < 0.05 versus the control group, *p < 0.05 versus the model group.
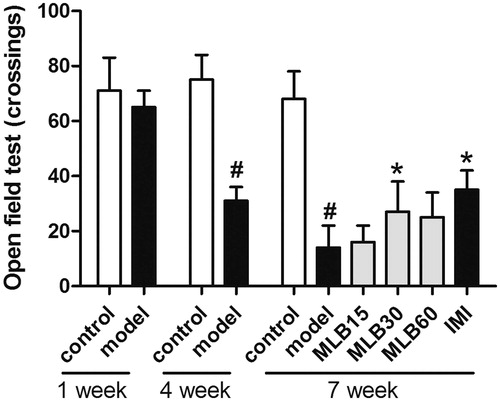
Figure 4. Antidepressant-like effects of MLB in rats during the (A) FST and (B) TST. MLB, magnesium lithospermate B; FST, forced swimming test; TST, tail suspension test. Values are expressed as the mean ± S.D. n = 8. Significance was determined by ANOVA followed by Tukey’s test. #p < 0.05 versus the control group, *p < 0.05 versus the model group.
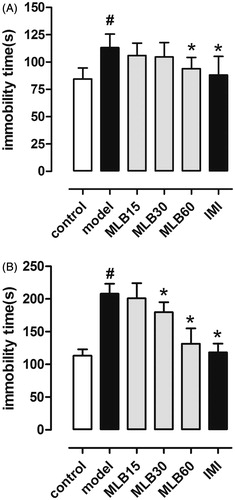
Figure 5. Effects of MLB on CORT levels in the serum. MLB, magnesium lithospermate B; CORT, corticosterone. Values are expressed as the mean ± S.D. n = 8. Significance was determined by ANOVA followed by Tukey’s test. #p < 0.05 versus the control group, *p < 0.05 versus the model group.
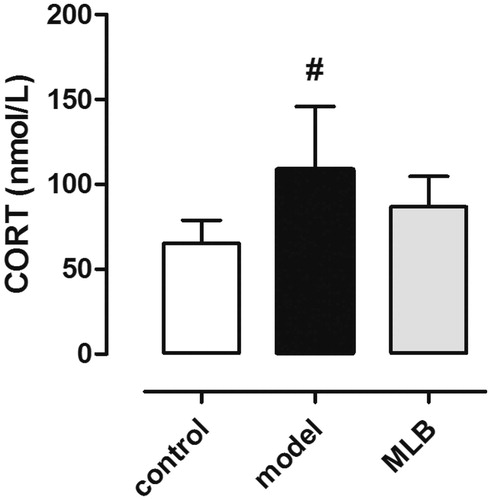
Figure 6. Effects of MLB on (A) IL-1β, (B) IL-6, and (C) TNF-α levels in serum. MLB, magnesium lithospermate B; IL-1β, interleukin 1β; IL-6, interleukin 6; TNF-α, tumor necrosis factor-α. Values are expressed as the mean ± S.D. n = 8. Significance was determined by ANOVA followed by Tukey’s test. #p < 0.05 versus the control group, *p < 0.05 versus the model group.
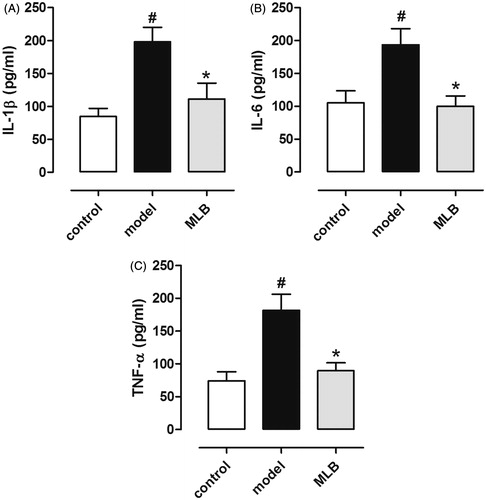
Figure 7. Effects of MLB on the tissue levels of (A) IL-1β, (B) IL-6, and (C) TNF-α. MLB, magnesium lithospermate B; IL-1β, interleukin 1β; IL-6, interleukin 6; TNF-α, tumor necrosis factor-α. Values are expressed as the mean ± S.D. n = 8. Significance was determined by ANOVA followed by Tukey’s test. #p < 0.05 versus the control group, *p < 0.05 versus the model group.
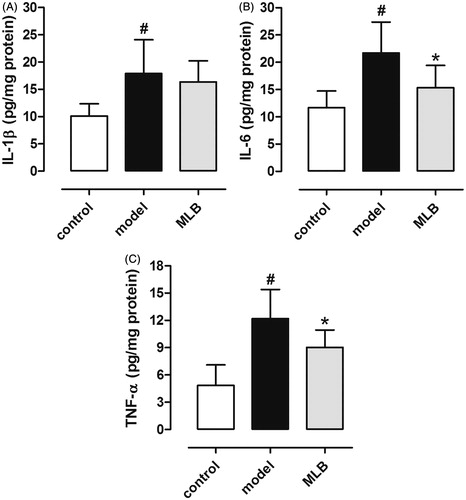
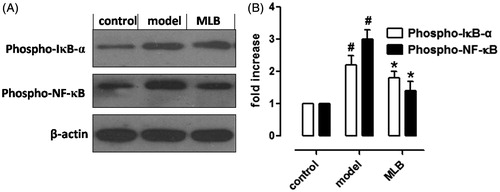
Figure 8. Effects of MLB on phosphorylated proteins that are involved in inflammation. (A) Phosphorylation of IκB-α and NF-κB was analyzed by western blot. (B) Graphs showing the protein ratio of phospo-IκB-α/β-actin and phospo-NF-κB/β-actin. MLB, magnesium lithospermate B; NF-κB, nuclear factor kappa B. Values are expressed as the mean ± S.D. n = 8. Significance was determined by ANOVA followed by Tukey’s test. #p < 0.05 versus the sham group, *p < 0.05 versus the control group.