Figures & data
Table 1. Classes of compounds and major constituents of the essential oils tested.
Figure 1. Viability of human chondrocytes (A and B) and C2BBe1 cells (C and D) treated with the EOs for 24 h in the absence (A and C) or presence (B and D) of the respective pro-inflammatory stimulus. Each column represents, at least, four independent experiments. The dotted line represents the limit below which cell viability is impaired. §p < 0.05 and §§p < 0.01 relative to the respective control (untreated) cells.
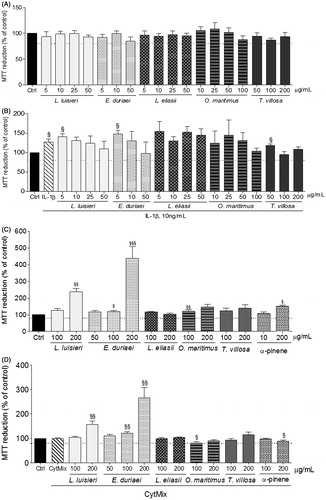
Figure 2. Effect of EOs on iNOS protein expression in human chondrocytes left untreated (Ctrl) or treated with IL-1β, 10 ng/mL, for 24 h, after pre-treatment with each EO. The images shown are representative of, at least, three independent experiments. **p < 0.01 and ***p < 0.001 relative to cells treated with IL-1β. #p < 0.05 and ##p < 0.01 between different concentrations of the same essential oil (one-way ANOVA).
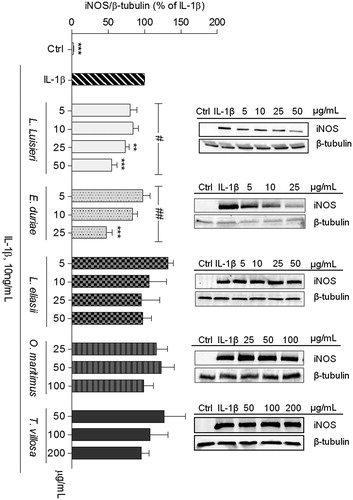
Figure 3. Effect of EOs on iNOS protein expression in C2BBe1 cells left untreated (Ctrl) or treated with CytMix, for 24 h, after pre-treatment with each EO. The images shown are representative of, at least, three independent experiments. *p < 0.05, **p < 0.01, and ***p < 0.001 relative to cells treated with CytMix.
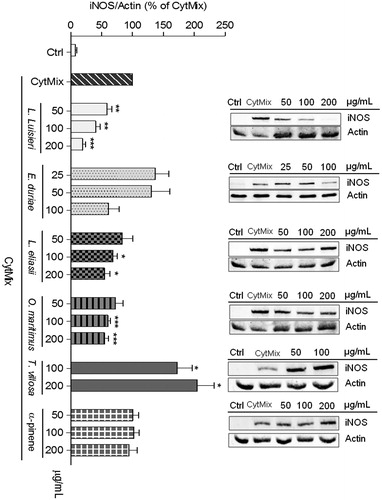
Figure 4. Effect of EOs on IL-1β-induced NO production in human chondrocytes left untreated (Ctrl) or treated with IL-1β, 10 ng/mL, for 24 h, after pre-treatment with each EO. Each column represents, at least, four independent experiments. *p < 0.05, and ***p < 0.001 relative to IL-1β-treated cells.
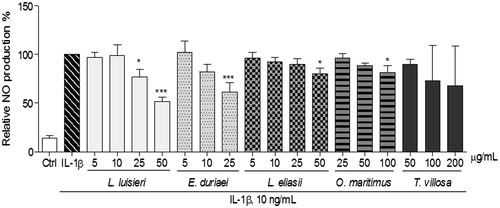
Figure 5. Effect of EOs of L. luisieri and E. duriaei subsp. juresianum on IL-1β-induced IκB-α phosphorylation and degradation in chondrocytes left untreated (Ctrl) or treated with IL-1β, 10 ng/mL, for 5 (A) or 30 min (B) after pre-treatment with the EOs or Bay 11-7082 (5 µM). The images shown are representative of, at least, four independent experiments. *p < 0.05 and ***p < 0.001 relative to IL-1β-treated cells. §p < 0.05 and §§§p < 0.001 relative to Ctrl.
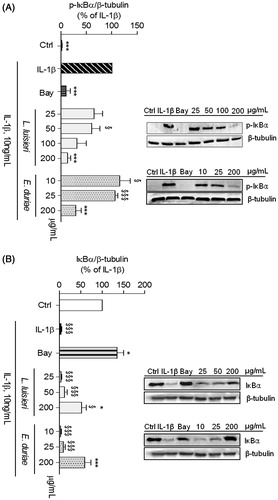
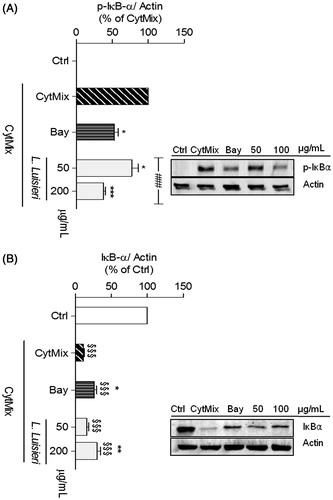
Figure 6. Effect of EOs of L. luisieri on CytMix-induced IκB-α phosphorylation and degradation in intestinal C2BBe1 cells left untreated (Ctrl) or treated with CytMix for 5 min (A) or 30 min (B) after pre-treatment with the EO or Bay 11-7082 (5 µM). The images shown are representative of, at least, four independent experiments. *p < 0.05, **p < 0.01, and ***p < 0.001 relative to CytMix-treated cells. §§§p < 0.001 relative to Ctrl and ###p < 0.001 between different concentrations of the same essential oil (one-way ANOVA).