Figures & data
Table 1. Primers used in real time quantitative PCR analysis.
Figure 1. The inhibitive effect of chrysin on foam cell formation induced by ox-LDL in RAW264.7 cells. (A) Typical photographs of RAW264.7 macrophages after oil-red O staining. Bar = 20 μm. (B) Cell surface area measured by Image-Pro Plus. Results are representative of four different experiments. ###p < 0.001 versus the blank group, **p < 0.01 versus the control group.
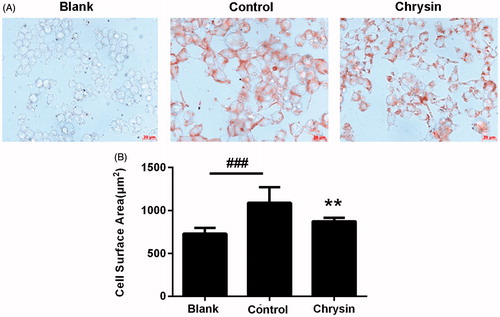
Figure 2. The inhibitive effect of chrysin on ox-LDL-elicited lipid accumulation in RAW264.7 cells. (A) Spectrophotometry at 358 nm of RAW264.7 macrophages after oil-red O staining. (B) Intracellular concentration of cholesterol. RAW264.7 cells were treated with lovastatin (1 μM), rosiglitazone (1 μM) or indicated concentration of chrysin in serum-free DMEM containing ox-LDL (50 μg/mL) for 24 h then subjected to oil red O staining and intracellular cholesterol quantification. Values represent mean ± SD. Results are representative of four different experiments. ###p < 0.001 versus the blank group, *p < 0.05, **p < 0.01, ***p < 0.001 versus the control group.
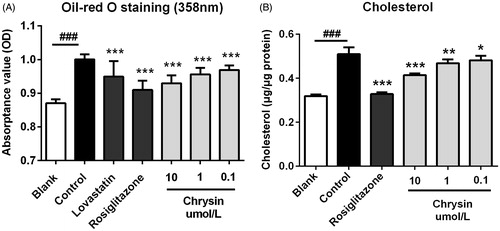
Figure 3. Chrysin enhances HDL-mediated cholesterol efflux from RAW264.7 macrophages. Cells were treated with rosiglitazone (1 μM) or indicated concentration of chrysin for 6 h after incubation with 25-NBD cholesterol for 24 h. Values represent mean ± SD. Results are representative of four different experiments. *p < 0.05, **p < 0.01 versus the control group.
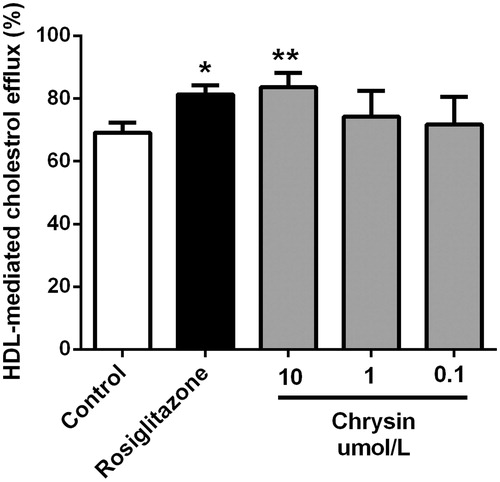
Figure 4. Chrysin increases transcription of PPARγ, LXRα, ABCA1, and ABCG1 in RAW264.7 macrophages. mRNA levels were quantified by real-time PCR using specific primers. Values represent mean ± SD. Results are representative of three different experiments. ***p < 0.001 versus the control group.
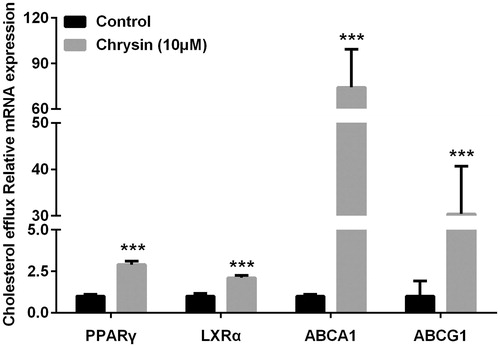
Figure 5. Chrysin increases transcriptional activity of PPARγ. The transcriptional activity was evaluated by luciferase assay. Values represent mean ± SD. Results are representative of three different experiments. **p < 0.01, ***p < 0.001 versus the control group.
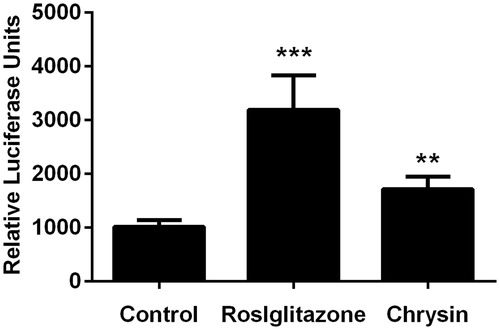
Figure 6. Chrysin inhibits cholesterol uptake by RAW264.7 macrophages. Cholesterol uptake assay using 25-NBD cholesterol as a fluorescence indicator. Values represent mean ± SD. Results are representative of three different experiments.
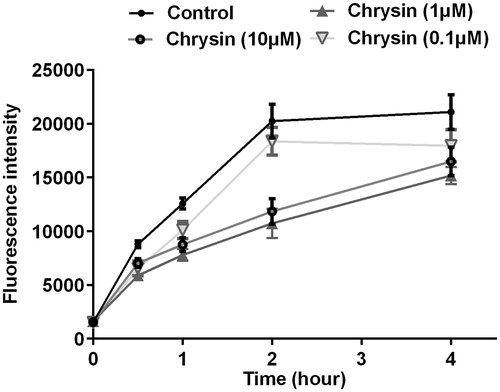
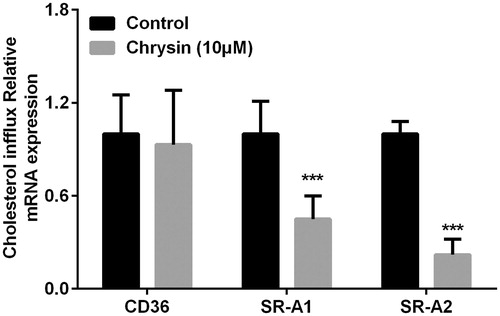
Figure 7. Chrysin regulates transcription of CD36, SR-A1, and SR-A2 in RAW264.7 macrophages. mRNA levels were quantified by real-time PCR using specific primers. Values represent mean ± SD. Results are representative of three different experiments. ***p < 0.001 versus the control group.