Figures & data
Figure 1. Chemical structures of the lead molecules present in mint essential oil.
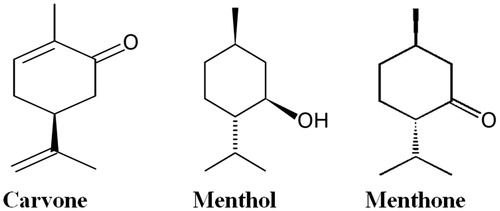
Figure 2. UV spectrophotometric sterol profiles of representative fluconazole-susceptible (A) and fluconazole-resistant (B) Candida strains. Strains were grown for 16 h in Sabouraud dextrose broth containing MIC/4, MIC/2, and MIC values of mint EO (curves c, d, and e); carvone (curves f, g, and h); menthol (curves i, j, and k), and menthone (curves l, m, and n), respectively. Curve ‘a’ is control (untreated cells) while curve ‘b’ shows positive control (FLC). Sterols were extracted from the cells and spectral profiles between 240 and 300 nm were determined.
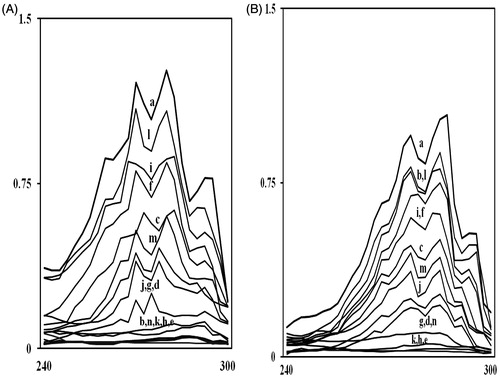
Table 1. GC-MS analysis of mint essential oil.
Table 2. Effect of mint essential oil and its lead compounds on the rate of H+-efflux by Candida cells at pH 7.0: Cells were suspended in 0.1 mM CaCl2 and 0.1 M KCl at 25 °C.
Table 3. Reduction in ergosterol content by mint essential oil, carvone, menthol and menthone in Candida cells.
Table 4. Synergistic antifungal activity (MIC and FICI) of mint EO and its major compounds against fluconazole-sensitive standard strains and fluconazole-resistant strains.
Figure 3. Scanning electron micrographs of C. albicans ATCC 90028 untreated control cells (A) treated with mint EO (B) and treated with carvone (C). Black arrow indicates damage and wrinkling of cell surface, white arrow indicates leakage of the cellular content.
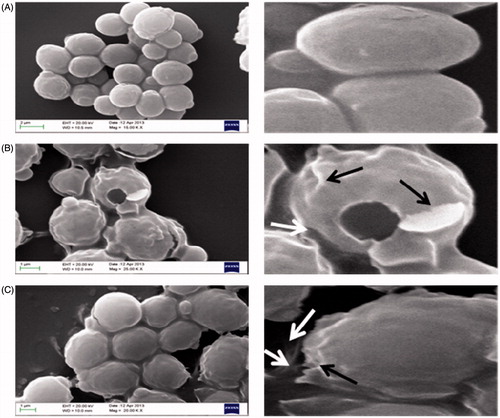
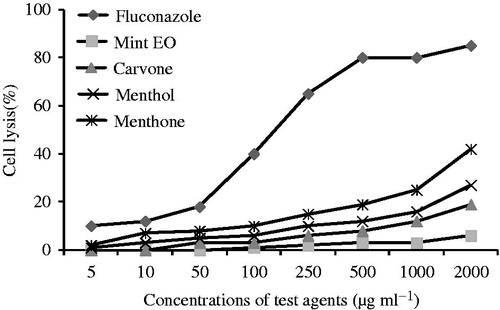
Figure 4. Hemolysis caused by mint EO, carvone, menthol, menthone, and fluconazole was determined by recording an absorbance at 450 nm and compared with hemolysis achieved with 1% Triton X-100 (reference for 100% hemolysis). The data shown are the mean of triplicate experiments.