Figures & data
Table 1. Physicochemical properties of SOPs.
Figure 1. Effects of SOPs on phagocytic activity of macrophage. Values are means ± SEM; ***p < 0.001 versus PBS control.
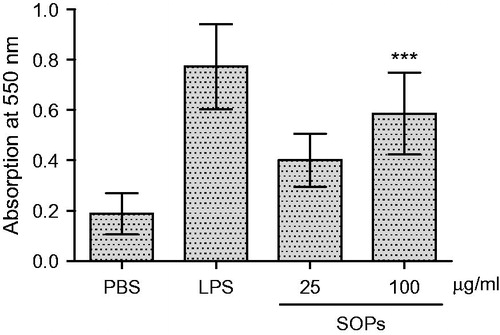
Figure 2. Effect of SOPs on TNF-α secretion by RAW 264.7 macrophages. Values are means ± SEM; **p < 0.01 versus the control group; #p > 0.05 versus the LPS group.
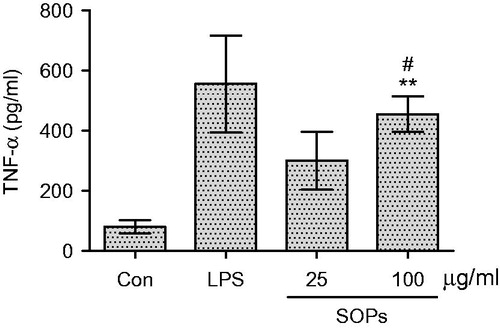
Figure 3. Effect of SOPs on NO secretion by RAW 264.7 macrophages. Values are means ± SEM; **p < 0.01 versus the control group; #p > 0.05 versus the LPS group.
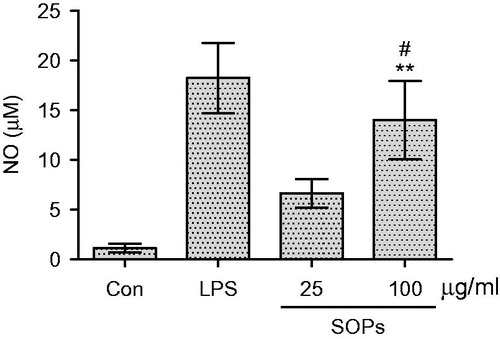
Figure 4. Effect of SOPs on the mRNA transcript level of TNF-α and iNOS in RAW 264.7 macrophages by RT-PCR. Transcripts of GAPHD were served as internal controls. A representative gel graph from three experiments was shown. The semi-quantitative analysis of mRNAs level of TNF-α (B) and iNOS (C) was performed using ImageJ software (National Institutes of Health, Bethesda, MD). Values are means ± SEM; *p < 0.05 and **p < 0.01 versus the control group; #p > 0.05 versus the LPS group.
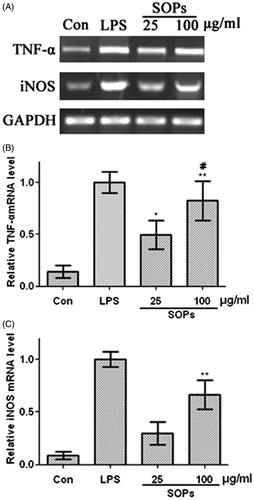
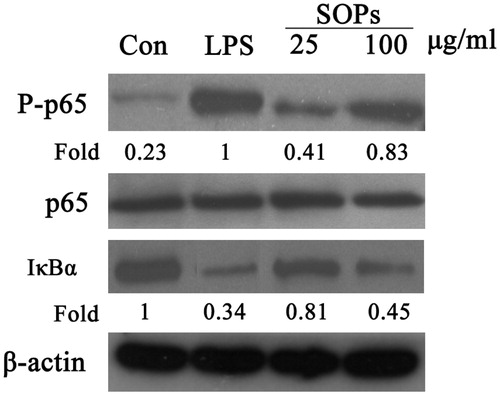
Figure 5. SOPs induced NF-κB activation in RAW 264.7 macrophages. RAW 264.7 macrophages were exposed to SOPs for 24 h. The whole cell lysates were probed with indicated antibodies. The quantitative analysis was performed using ImageJ software. The images are a representative of three independent experiments.