Figures & data
Figure 1. HPLC fingerprint of PLA at 254 nm. (1) Piperlonguminine, (2) piperanine, (3) piperine, and (4) pellitorine.
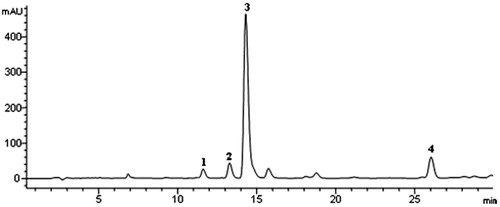
Figure 2. Behavioral performance tested in open-field test. (A1) Total distance of different groups of mice in the open field from 1 d to 28 d (*p < 0.05 versus control; #p < 0.05 versus model). (A2) Total distance of different groups of mice in the open field from 35 d to 56 d (*p < 0.05 versus control; #p < 0.05 versus model). (B1) Total time of different groups of mice in the open field from 1 d to 28 d (s) (*p < 0.05 versus control; #p < 0.05 versus model). (B2) Total time of different groups of mice in the open field from 35 d to 56 d (s) (*p < 0.05 versus control; #p < 0.05 versus model). Data are expressed as mean ± SD (NModel group = 14, NOther groups = 12).
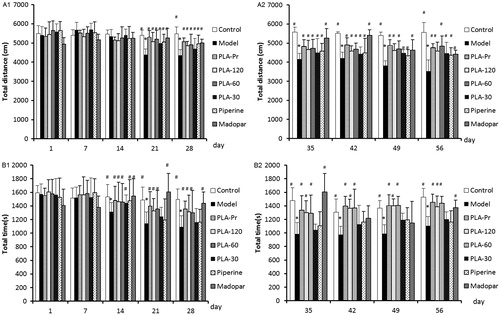
Table 1. Transmitter contents (ng/g wet brain tissue; mean ± SD) in the striatum analyzed by UFLC-ESI-MS/MS.
Figure 3. (A) The photographs of the protective effects of PLA on the MPTP-induced loss of tyrosine hydroxylase (TH)-immunoreactive neurons in the substantia nigral pars compacta (SNpc). (a1 and a2) The control group (n = 12); (b1 and b2) the model group (n = 14); (c1 and c2) the PLA prevention group (n = 12); (d1–f2) PLA (120, 60, and 30 mg/mL) treated plus MPTP-injected groups (n = 12); (g1 and g2) piperine (60 mg/mL) treated plus MPTP-injected group (n = 12); (h1 and h2) the Madopar group (n = 12). (B) The number of TH-immunoreactive neurons in the SNpc of the different groups (*p < 0.05 and **p < 0.01 versus control; #p < 0.05 and ##p < 0.01 versus model).
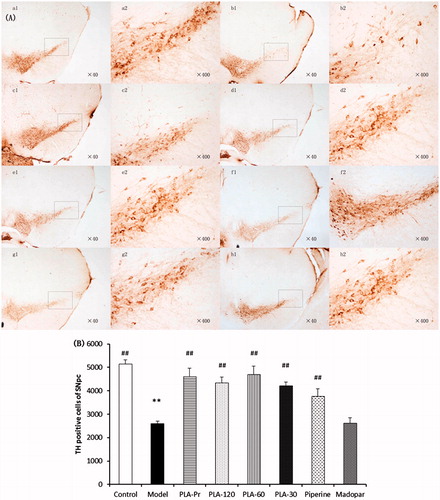
Figure 4. The contents of TH expression in different groups detected by Western blot. β-Actin was used as the internal control. Results were expressed as mean ± SD (NModel group = 14, NOther groups = 12, *p < 0.05 and **p < 0.01 versus control; #p < 0.05 and ##p < 0.01 versus model).
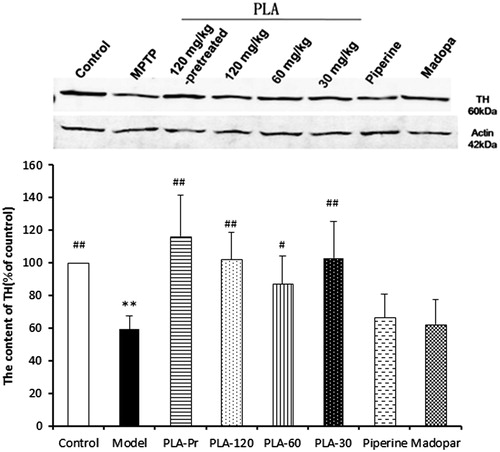
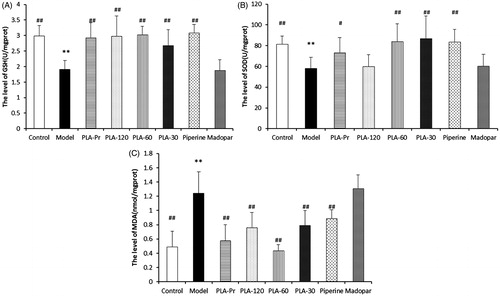
Figure 5. The levels of glutathione (GSH), superoxide dismutase (SOD), and malondiadehycle (MDA) in different groups. (A) GSH, (B) SOD, and (C) MDA (N = 9, *p < 0.05 and **p < 0.01 versus control; #p < 0.05 and ##p < 0.01 versus model).