Figures & data
Figure 1. Chemical structure of galbanic acid.
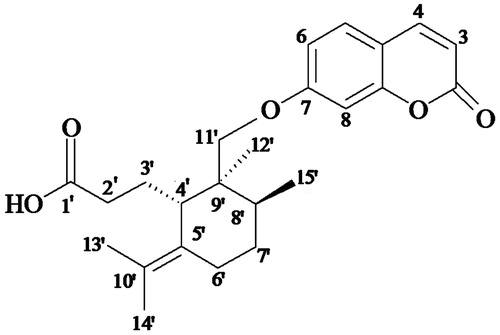
Figure 2. SEM images of (A) blank SLNs (F10) and (B) GBA-SLNs (F19), and zeta potential of (C) F10 and (D) F19. (F10) and (F19) represent the formulation code of 10 and 19 for blank SLNs and GBA-SLN, respectively.
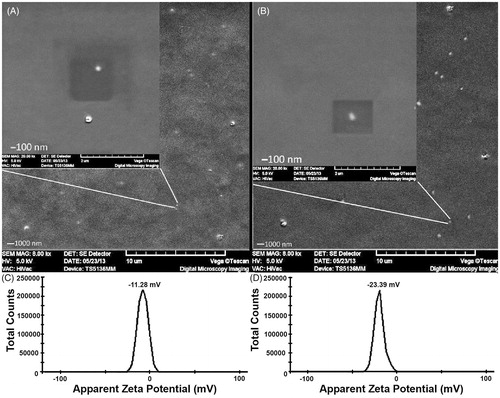
Table 1. Composition, particle size, and encapsulation efficiency (EE) of galbanic acid-loaded SLNs formulation.
Figure 3. Cumulative release of GBA from SLNs under medium containing 0.3% Tween 80, at different temperatures (24 and 37 °C) and pHs (7.4 and 5.6) after 16 h (384 h). All data represent the mean of at least three-recorded OD (error bars represent mean ± SD).
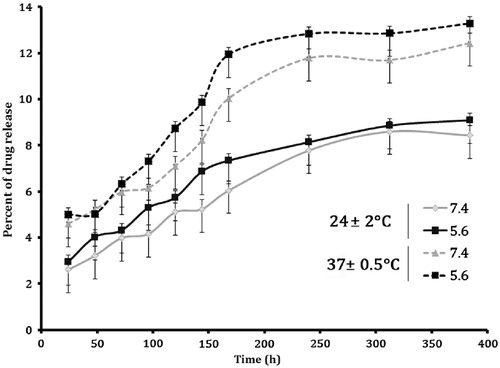
Table 2. The kinetics models used to fit the release data.
Table 3. Physical stability and drug leakage studies of the GBA-SLNs.
Figure 4. The differences in formulated SLNs size between the initial (A) and 3 months after storage at (B) 4 °C and (C) 24 °C were not found to be statistically significant.
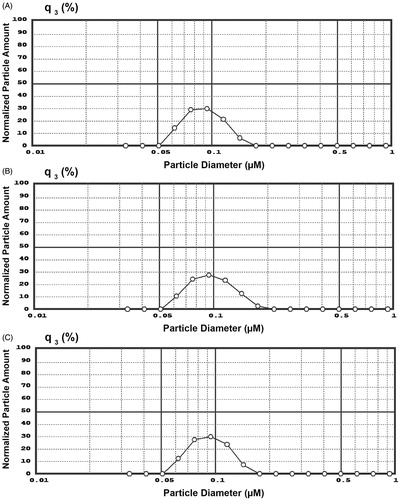
Figure 5. Inhibition properties of plain GBA (black) and GBA-SLNs (gray) on A549 human lung epithelial carcinoma after (A) 24 h, (B) 48 h, and (C) 72 h. (D), (E), and (F) MTT result of treatment of plain GBA (black) and GBA-SLNs (gray) on HUVEC after 24 h and 48 h and 72 h, respectively. Error bars represent SD (n=3).
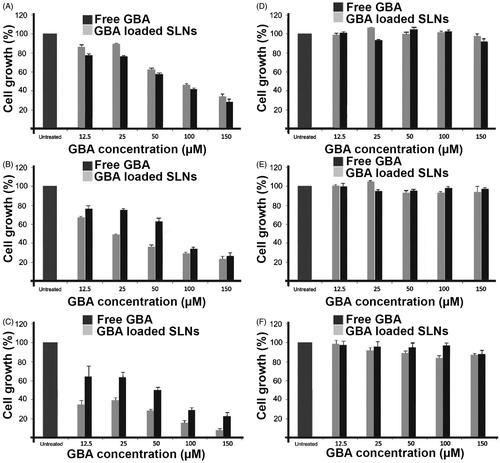
Figure 6. Light and fluorescent microscopy images of A549 cells and HUVEC stained with DAPI; (A) the HUVEC and (B) A549 cell line are shown. The arrows show fragmented nucleus in the treated cells.
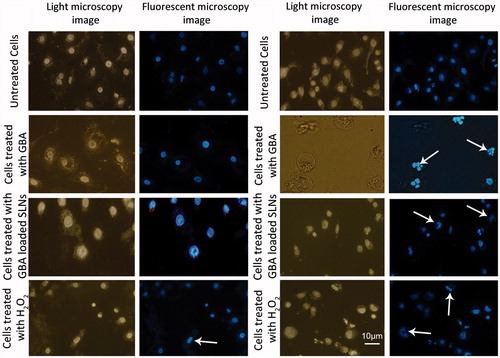
Figure 7. Photographic illustrations of comet assay after 48 h incubation. (A) Untreated A549 cells, (B) treated A549 cells by 200 µM H2O2 (positive control), (C) treated A549 cells by GBA, and (D) treated A549 cells by GBA-SLNs. (E) Box-plot graph of DNA tail/DNA head% is shown; the DNA cleavage level in GBA and GBA-SLN-treated cells is not as high as treated cells with 200 mM H2O2 but is significantly (p<0.001) higher than untreated cells.
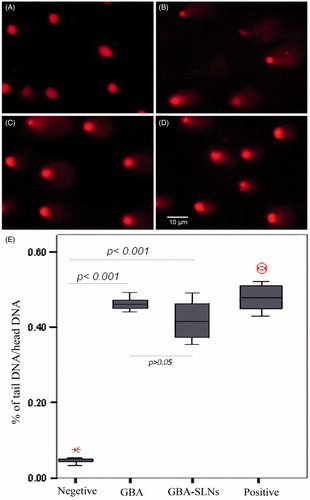
Figure 8. DNA ladder formation through gel electrophoresis in different treatments, and A549 cells and HUVEC. M, molecular marker.
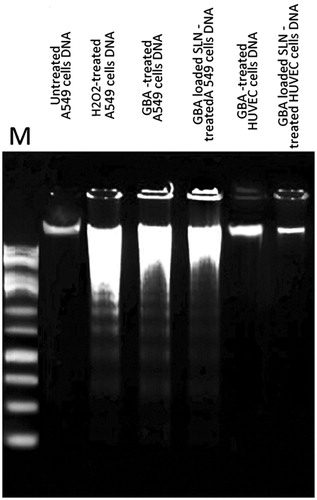
Figure 9. FITC-labeled annexin V flow cytometric detection of apoptosis in A549 cells. (A) Untreated control cells, (B) treated cells with 200 µM H2O2 as a positive control, (C) treated cells with GBA, and (D) treated cells with GBA-loaded SLNs.
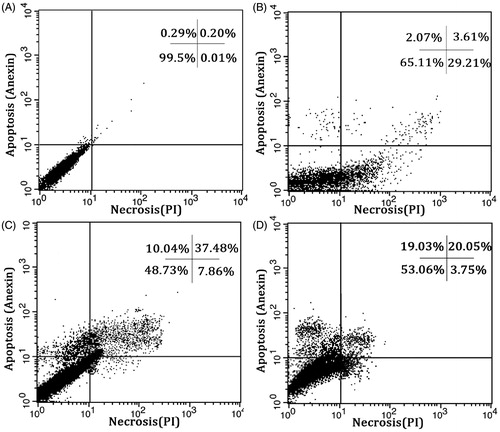
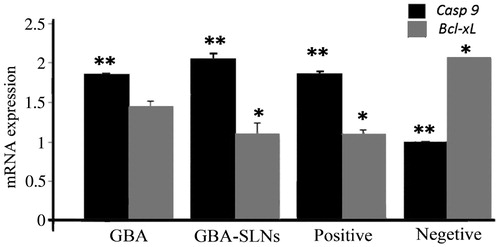
Figure 10. Differential expression levels of Casp 9 and Bcl-xL genes in plain GBA, GBA-SLNs, and doxorubicin (as positive control). * and ** represent significant differences (p < 0.05).