Figures & data
Table 1. Comparative assessment of histopathological findings of ovary in experimental and control groups and the protective effects of ANP and CLV.
Figure 1. Ovarian sections of control and experimental groups. (A) Lower magnification (40×) of ovarian section showing normal folliculogenesis as well as several CL from the control rat. (B) Higher magnification (400×) of control ovary showing fresh CL. (C) Higher magnification (400×) of two intact antral follicles with a clear oocyte surrounded by cumulus cells and several layers of granulosa cells (×400). (D) Section of ovary from PCO rats showing multiple fluid-filled sub-capsular cysts (40×). (E) Higher magnification (400×) of a fluid-filled large cystic follicle of PCO rats with a degenerated thin layer of granulosa cells and hyperplasia of theca cells (×400). (F) Higher magnification (400×) of one antral degenerating atretic follicle showing detached floating oocyte. (G) An antral atretic follicle with a malformed oocyte and luteinized theca cells (400×). (H) Section of the ovary from the PCO + CVL group showing normal developing follicles and several CL (×40). (I) Section of the ovary from the PCO + ANP group showing normal developing follicles and several CL (×40). AF, antral follicle; AAF, atretic antral follicle; CF, cystic follicle; CL, corpora lutea; LGW, luteinized follicular wall; MF, mature follicle; MO, malformed oocyte.
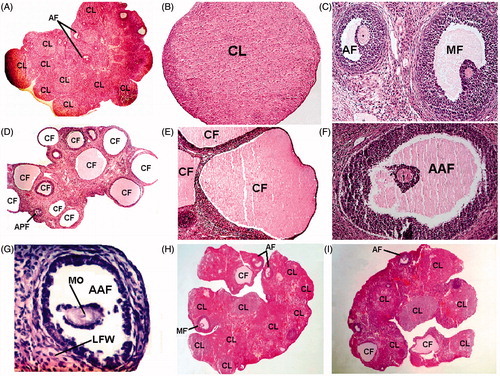
Figure 2. Comparative assessment of serum LPO in control and experimental groups of rats. aA significant difference between control and other treated groups at p < 0.05 level. bA significant difference among PCO−, PCO + ANP−, and PCO + CVL-treated groups at p < 0.05 level. CVL, carvedilol; ANP, ANGIPARS™; PCO, polycystic ovary; LPO, lipid peroxidation.
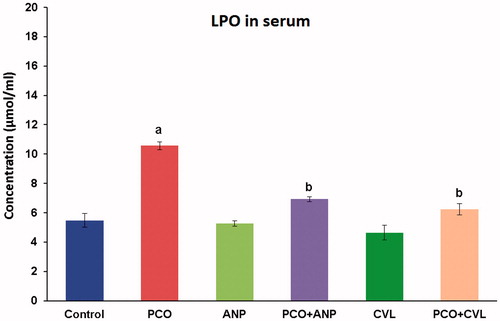
Figure 3. Comparative assessment of ovarian LPO in control and experimental groups of rats. aA significant difference between control and other treated groups at p < 0.05 level. bA significant difference among PCO−, PCO + ANP−, and PCO + CVL-treated groups at p < 0.05 level. CVL, carvedilol; ANP, ANGIPARS™; PCO, polycystic ovary; LPO, lipid peroxidation.
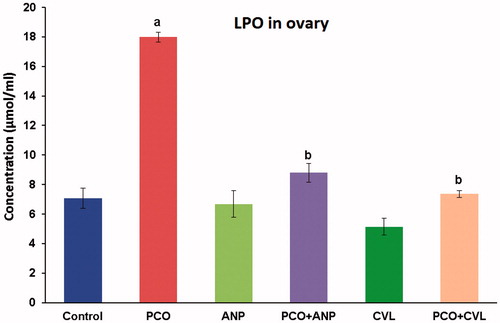
Figure 4. Comparative assessment of ROS in serum in control and experimental groups of rats. aA significant difference between control and other treated groups at p < 0.05 level. bA significant difference among PCO−, PCO + ANP−, and PCO + CVL-treated groups at p < 0.05 level. CVL, carvedilol; ANP, ANGIPARS™; PCO, polycystic ovary; ROS, reactive oxygen species.
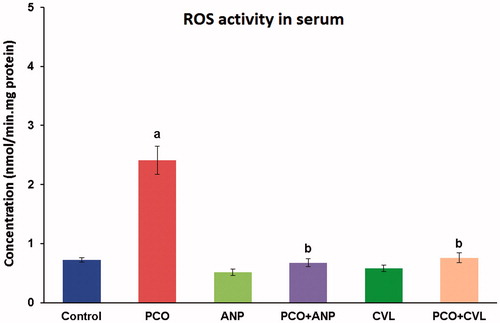
Figure 5. Comparative assessment of ROS in ovary in control and experimental groups of rats. aA significant difference between control and other treated groups at p < 0.05 level. bA significant difference among PCO−, PCO + ANP−, and PCO + CVL-treated groups at p < 0.05 level. CVL, carvedilol; ANP, ANGIPARS™; PCO, polycystic ovary; ROS, reactive oxygen species.
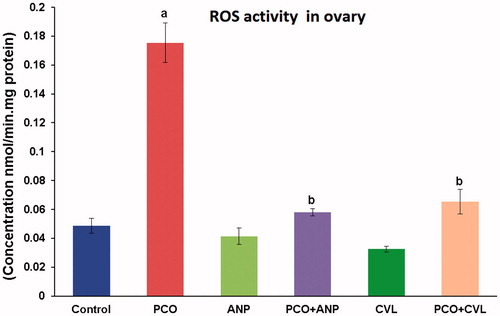
Figure 6. Comparative assessment of TAP in serum in control and experimental groups of rats. aA significant difference between control and other treated groups at p < 0.05 level. bA significant difference among PCO−, PCO + ANP−, and PCO + CVL-treated groups at p < 0.05 level. CVL, carvedilol; ANP, ANGIPARS™; PCO, polycystic ovary; TAP, total antioxidant power.
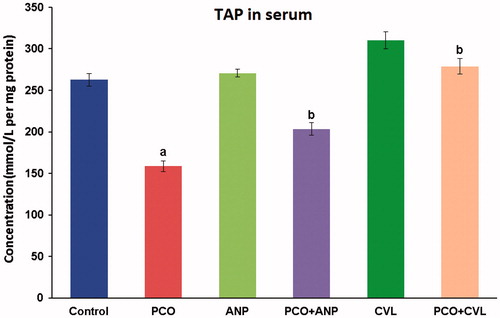
Figure 7. Comparative assessment of TAP in ovary in control and experimental groups of rats. aA significant difference between control and other treated groups at p < 0.05 level. bA significant difference among PCO−, PCO + ANP−, and PCO + CVL-treated groups at p < 0.05 level. CVL, carvedilol; ANP, ANGIPARS™; PCO, polycystic ovary; TAP, total antioxidant power.
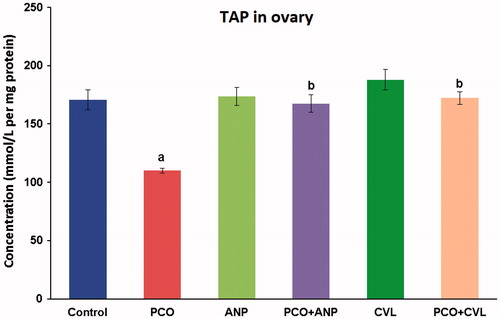
Figure 8. Comparative assessment of serum TNF-α concentration in control and experimental groups of rats. aA significant difference between control and other treated groups at p < 0.05 level. bA significant difference among PCO−, PCO + ANP−, and PCO + CVL-treated groups at p < 0.05 level. CVL, carvedilol; ANP, ANGIPARS™; PCO, polycystic ovary; TNF-α, tumor necrosis factor alpha.
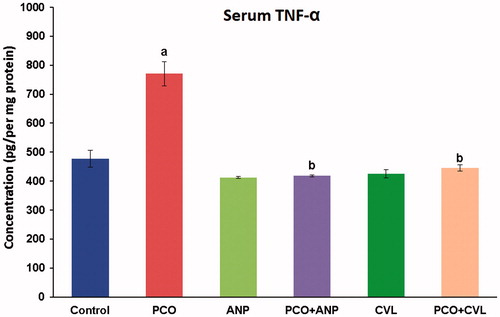
Figure 9. Comparative assessment of serum insulin concentration in control and experimental groups of rats. aA significant difference between control and other treated groups at p < 0.05 level. bA significant difference among PCO−, PCO + ANP−, and PCO + CVL-treated groups at p < 0.05 level. CVL, carvedilol; ANP, ANGIPARS™; PCO, polycystic ovary.
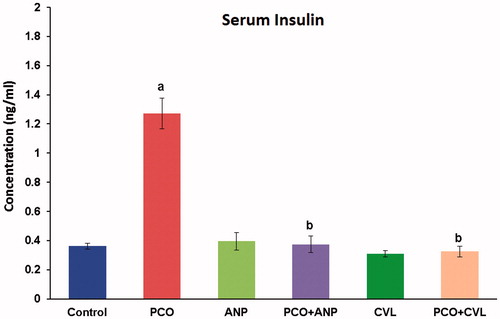
Figure 10. Comparative assessment of serum testosterone concentrations in control and experimental groups of rats. aA significant difference between control and other treated groups at p < 0.05 level. bSignificant difference among PCO−, PCO + ANP−, and PCO + CVL-treated groups at p < 0.05 level. CVL, carvedilol; ANP, ANGIPARS™; PCO, polycystic ovary.
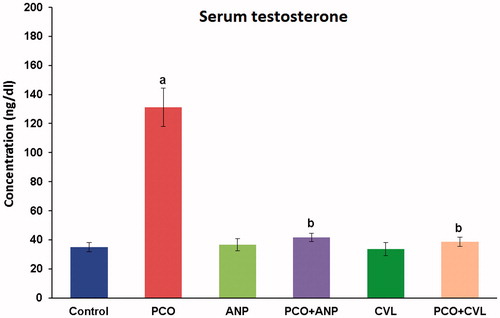
Figure 11. Comparative assessment of serum progesterone concentrations in control and experimental groups of rats. aA significant difference between control and other treated groups at p < 0.05 level. bA significant difference among PCO−, PCO + ANP−, and PCO + CVL-treated groups at p < 0.05 level. CVL, carvedilol; ANP, ANGIPARS™; PCO, polycystic ovary.
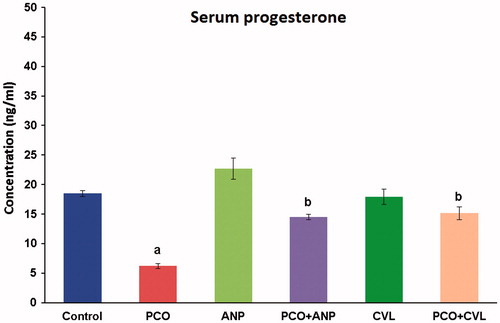
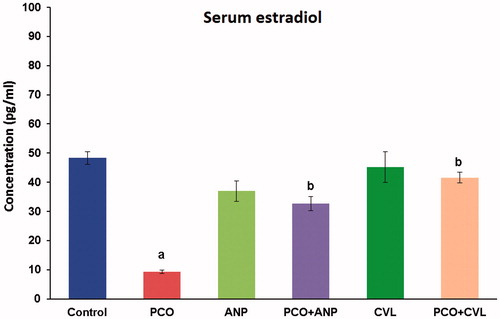
Figure 12. Comparative assessment of serum estradiol concentrations in control and experimental groups of rats. aS significant difference between control and other treated groups at p < 0.05 level. bA significant difference among PCO−, PCO + ANP−, and PCO + CVL-treated groups at p < 0.05 level. CVL, carvedilol; ANP, ANGIPARS™; PCO, polycystic ovary.