Figures & data
Figure 1. Chemical Structure of CAP.
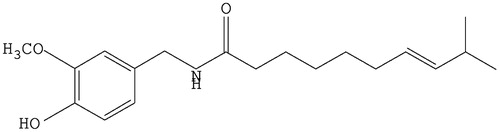
Table 1. The drug loading and encapsulation efficiency of CAP-HP-β-CD inclusion complexes prepared by different methods (n = 3).
Table 2. Results of inclusion ratio of inclusion complex by continuous variation method (n = 3).
Figure 2. The ultraviolet absorption spectrum of CAP in aqueous solution before and after the adding of HP-β-CD: (a) CAP-HP-β-CD; (b) CAP; (c) HP-β-CD.
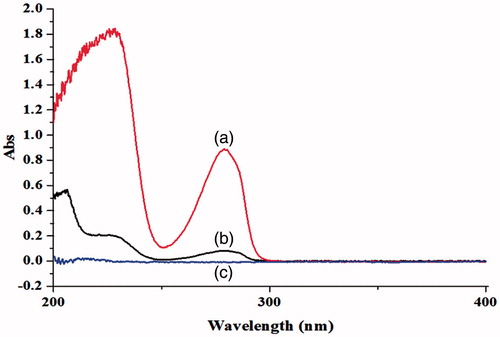
Figure 3. The IR spectra of CAP, HP-β-CD, CAP-HP-β-CD inclusion complex, and physical mixture of CAP/HP-β-CD.
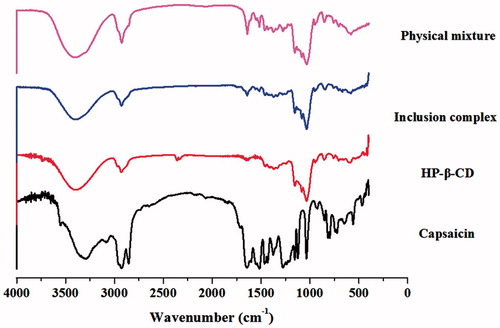
Figure 4. The DSC-thermograms of CAP, HP-β-CD, inclusion complex of CAP-HP-β-CD, and physical mixture of CAP/HP-β-CD.
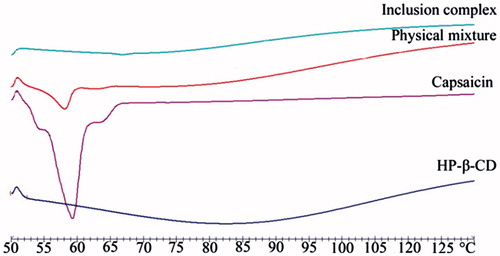
Figure 5. The equilibrium phase solubility diagrams of CAP with different concentrations of HP-β-CD in distilled water at different temperatures (n = 3).
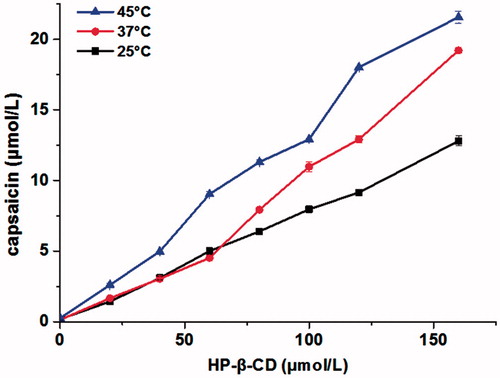
Table 3. Thermodynamic parameters of CAP-HP-β-CD inclusion complex at different temperatures.
Figure 6. Dissolution profiles of CAP from free CAP, physical mixture of CAP/HP-β-CD and CAP-HP-β-CD inclusion complex (n = 3).
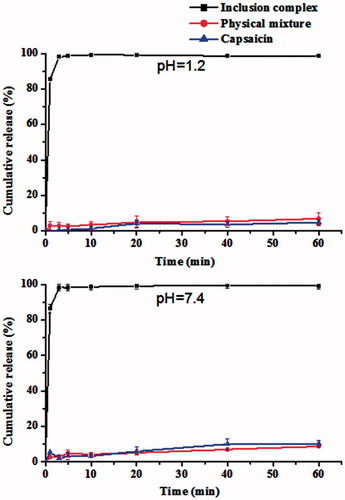
Figure 7. Drug concentration–time curve in plasma of CAP after intragastric administration (n = 6).
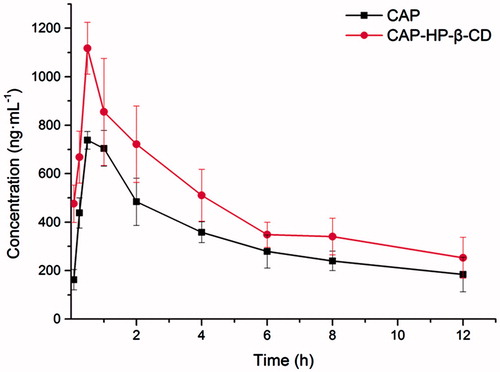
Table 4. Pharmacokinetic parameters after intragastric administration with compartmental model (mean, n = 6).
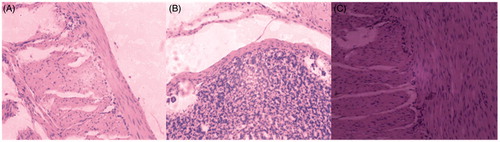
Figure 8. Gastric histopathologic sections of SD rats after intragastric administration (n = 6). (A) Normal saline; (B) free CAP; (C) CAP-HP-β-CD inclusion complex.