Figures & data
Table 1. Total phenolic content (TP, mg GAE/g ext.) of the extracts of the aerial parts of Melochia arenosa obtained for the 23 factorial and central composite designs.
Figure 1. Response surface plot showing the effects of plant:solvent proportion and extraction time on the total phenolic content of the ethanol extract of the aerial parts of Melochia arenosa.
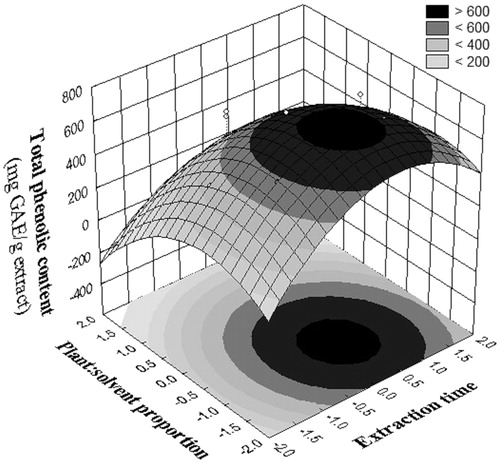
Table 2. ANOVA results to the model generated by central composite for total phenolic content and for antioxidant activity.
Figure 2. Photoacoustic spectra obtained with excitation performed in the epidermal side of the skin samples. The light modulation frequency was 25 Hz and the thermal diffusion length was 23 μm. Epidermis control – control skin sample without treatment; EF – formulation containing 1% optimized extract of the aerial parts of Melochia arenosa; BF epidermal side – skin sample treated with BF; EF epidermal side – skin samples treated with EF (amount applied 2 mg/cm2).
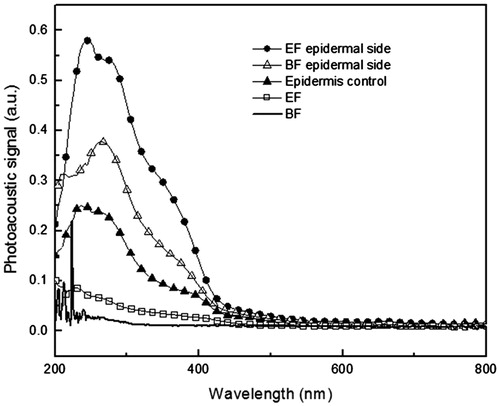
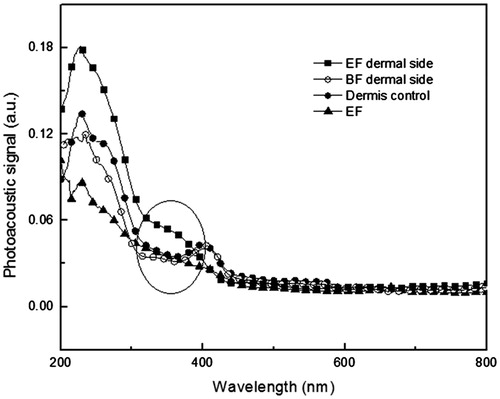
Figure 3. Photoacoustic spectra obtained with excitation performed in the dermal side of the skin samples. The light modulation frequency was 25 Hz and the thermal diffusion length was 23 μm. Dermis control − control skin sample without treatment; EF – formulation containing 1% optimized extract of aerial parts of Melochia arenosa; BF dermal side – skin sample treated with base formulation; EF dermal side – skin samples treated with EF (amount applied 2 mg/cm2). The highlight shows the presence of EF in the face dermal.