Figures & data
Figure 1. The schematic presentation of the HCVpc (CE6NE4) with encoding amino acids (Memarnejadian & Roohvand, Citation2010) which was employed in this study (A) and the nucleotide sequence comparison between original and tobacco plant optimized nucleotides in the corresponding HCVpc (B). The changes to the original sequence are shown by lower cases. Location of the Kozak sequence and 6×His-tag nucleotides are indicated. “ATG” denote the “Start” codons.
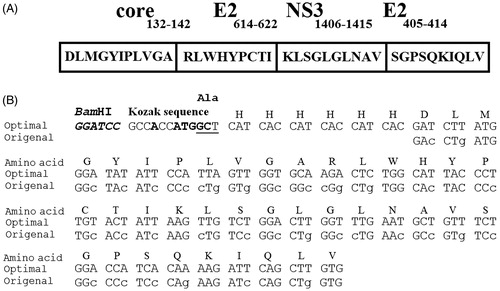
Table 1. List of the primers.
Figure 2. The distribution of codon usage frequency along the length of the HCVpc (CE6NE4) gene sequence before (right) and after (left) optimization for expression in N. tabacum. (A) The corresponding nucleotide alterations increased the codon adaptation index (CAI) value from 0.61 to 0.92 (the frequency of the non-optimized bases is decreased after optimization). The value of 100 is set for the codon with the highest usage frequency. (B) The corresponding nucleotide alterations reduced the GC content from 65.33 to 40.57.
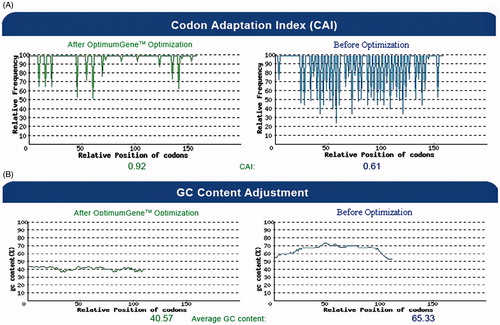
Figure 3. Schematic diagram for the construction of HCVpc–HBsAg segment (A) and agarose gel electrophoresis analyses results for different DNA fragments (B). (A) Strategy for the construction of fusion gene (see text for details); (a) pUC-polytope plasmid containing 150 bp polytope fragment, (b) pcDNA plasmid containing 680 bp HBsAg fragment, (c) constructed pcDNA–polytope–HBsAg. (B) Colony PCR analysis; lane 1: 10 kb DNA ladder, lanes 2, 3, and 5: positive fusion clones (the 870 bp fragment was amplified by the fusion polytope-HBsAg-specific primers), lane 4: positive fusion clone (the 170 bp fragment was amplified by polytope-specific primers), lane 6: intact pcDNA vector as negative control.
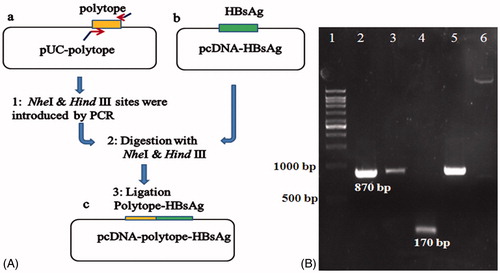
Figure 4. Schematic diagram of the constructed pVX–poly-HBs vector (A) and Western blotting analysis (B). (A) The synthetic and optimized gene after fusion to HBsAg was inserted into the ClaI/SalI sites of PVX-GW vector under the control of duplicated PVX-coat protein subgenomic-promoter (CPP). (B) Western blotting: lane 1: leaves agroinfiltrated with pVX-poly-HBs, lane 2: Prestained Protein Ladder (Fermentas, Amherst, NY). Lane 3: negative control (tobacco leaves transformed by pVX vector alone; i.e., without HCVpc–HBsAg gene). In lanes 1 and 3, around 50 µg of plant TSP were applied in each lane. Appearance of the doublet bands (indicated arrows) could be due to the presence of glycosylated and non-glycosylated forms of HBsAg (about 33 and 30 kDa) in the expressed HCVpc–HBsAg.
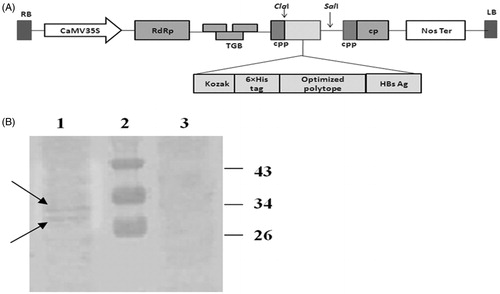
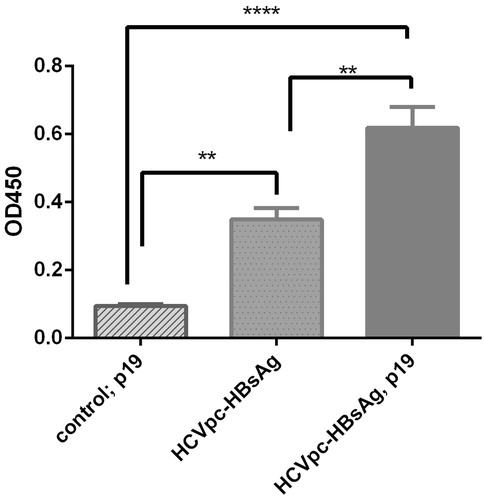
Figure 5. Analysis of the expression of HCVpc-HBsAg in tobacco leaves in the absence and presence of p19 co-agroinfiltration by ELISA. The expression of HCVpc–HBsAg by pVX–poly-HBs in tobacco leaves was compared in the presence or absence of co-agroinfiltration with gene-silencing suppressor p19 construct by ELISA. Leaf control that denotes the tobacco leaves transformed by pVX vector alone (i.e., without HCVpc–HBsAg gene) in the presence of co-agroinfiltration with p19 construct. The experiment was repeated three times at least.