Figures & data
Figure 1. The chemical structure of trans-3,4,5,4′-tetramethoxystilbene (DMU-212). DMU-212 has the molecular formula C18H20O4 and a molecular weight of 300.3490 g/mol.
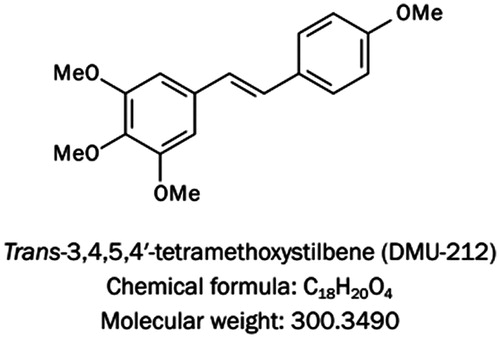
Table 1. Genes whose average expression differed by greater than 2-fold are grouped by functional category: labeled cRNA prepared from HUVECs at 6 h after infection with DMU-212 use Affymetrix Human GeneChip® Gene 1.0 ST Arrays.
Figure 2. Verification of microarray analysis by qRT-PCR. Histogram showed the mRNA levels of genes as indicated. Data are expressed as the mean (±SE) of three independent experiments. *p < 0.05, **p < 0.01 versus control.
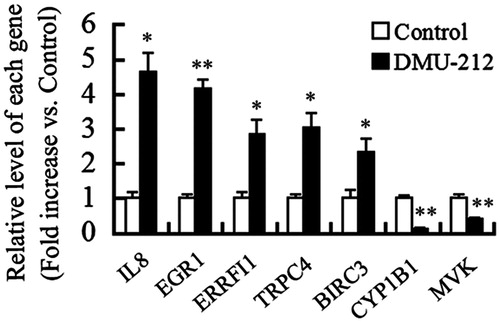
Figure 3. Biological process classification of the differential expressed genes using the GENEONTOLOGY (The Gene Ontology Consortium, Cambridge, UK) and PANTHER (Evolutionary Systems Biology Group, Menlo Park, CA) database.
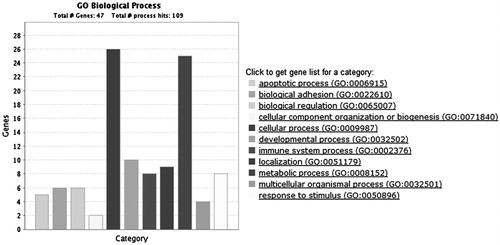
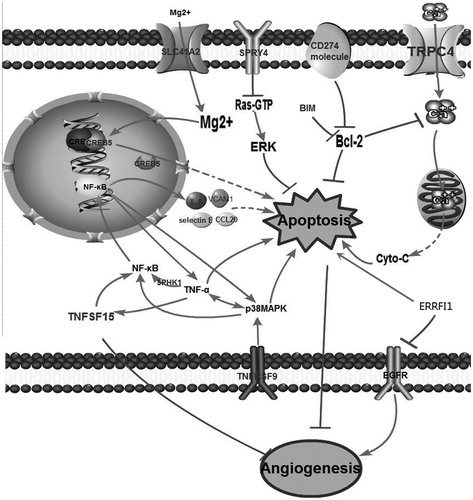
Figure 4. Network extension of the comprehensive signaling pathway collated by the differentially expressed genes that were regulated by DMU-212.