
Figures & data
Table 1. Some important physical parameters of investigated terpenes.
Figure 1. Permeation profile of valsartan across rat skin in the absence and presence of various terpenes at (a) 1% w/v, (b) 3% w/v, and (c) 5% w/v in vehicle (mean ± SD).
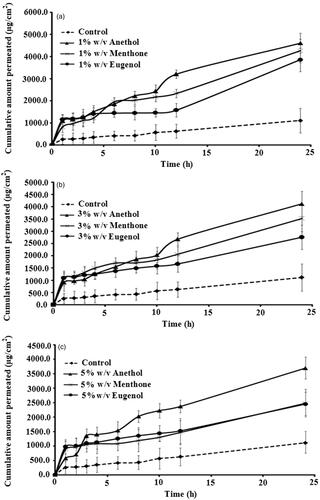
Table 2. Effect of different terpenes on permeation of valsartan across rat skin (mean ± SD).
Figure 2. DSC thermograms of control skin and treated with 1% w/v terpenes for 24 h.
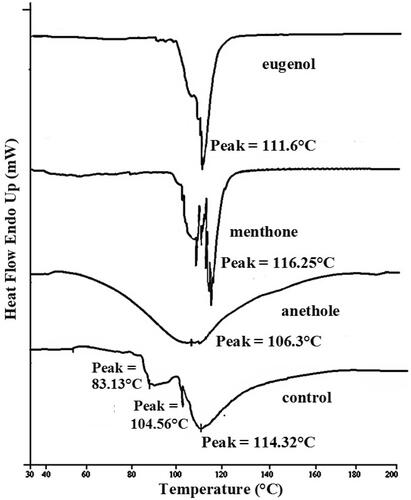
Figure 4. FTIR spectra of rat skin. Change in amide I (1640 cm−1) and amide II (1550 cm−1) vibrations after 24 h treatment with (a) control, (b) anethole, (c) menthone, and (d) eugenol.
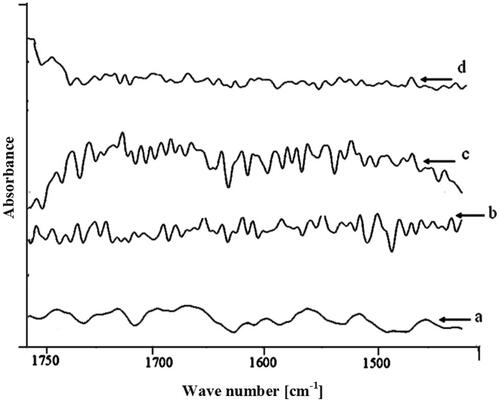
Figure 3. FTIR spectra of rat skin. Change in lipid C–H stretching (2920 cm−1) vibrations after 24 h treatment with (a) control, (b) anethole, (c) menthone, and (d) eugenol.
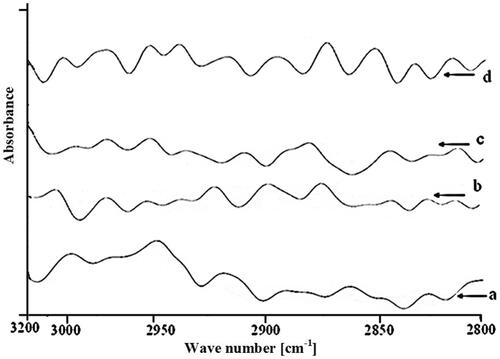
Table 3. Peak height of asymmetric CH and symmetric CH stretching absorbance before and after treatment of rat stratum corneum with control or 1% terpenes solutions for 24 h and their percentage decrease.