Figures & data
Table I. Global LV function. *indicates p < 0.05 compared to baseline MRI.
Table II. MRI data from microembolization using a mixture of 100–300 μm sized microemboli (Citation16) and homogenous infarcts caused by a 2-hour ischemia and reperfusion of the LAD at 7–8 weeks (Citation25) for comparison with the data of the present study. *indicates p < 0.05 compared to microinfarcts at 7–8 weeks caused by the 40–120 sized microemboli.
Figure 1. Longitudinal strain over the cardiac cycle decreased from baseline to one hour in both the area with microinfarcts (left) and remote (right) myocardium. There was a partial recovery at 7–8 weeks. *indicates p < 0.05 and ***p < 0.001 compared to baseline.
Figure 2. Circumferential strain over the cardiac cycle showed a persistent decline over the course of 7–8 weeks in both the area with microinfarcts (left) and remote myocardium (right). ***indicates p < 0.001 compared to baseline.
Figure 3. Systolic wall thickening in the area with microinfarcts (left) and remote myocardium (right) in three short axis slices through the embolized myocardium. *indicates p < 0.05 compared to baseline and †p < 0.05 compared to the area with microinfarcts within the same slice.
Figure 4. A. The area at risk for microinfarcts demonstrated on LGE shortly after intra-arterial injection of diluted Gd-DOTA. First-pass perfusion images at one hour (B) and 7–8 weeks (C) in two short-axis planes. The area with microinfarcts can be visualized as a perfusion defect (arrows) at one hour but not 7–8 weeks after microembolization.
Figure 5. First pass perfusion at one hour. There is a significant perfusion decrease at one hour in the microinfarcted territory compared to remote.
Figure 6. LGE images from one animal at one hour (left) and 7–8 weeks (right) after microembolization, A: horizontal long axis, B and C: short-axis. There are no detectable microinfarcts on LGE at one hour but at 7–8 weeks they were clearly visualized as areas of differential enhancement (arrows). The microinfarcts are patchy with interspersed viable myocardium, distributed in the transmural extent of the myocardium and show stripes or tongues of scarred tissue from the epicardium to the endocardium.
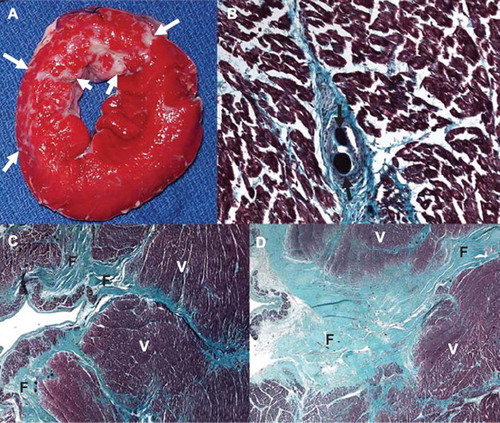
Figure 7. Histochemical and histopathological visualization of the heterogeneous small infarcts caused by microemboli (microinfarcts) and the deposition of microemboli in the coronary vasculature. A. TTC staining of the gross sample showing unstained pale areas (white arrows) corresponding to healed heterogeneous infarcts in the microembolized area. The short axis slice is displayed with the anterior wall up and the septum to the left. B. High power microscopic image from a Masson trichrome staining showing two microemboli (black arrows) trapped in the microvasculature and an organized thrombus surrounding it. C and D. Low power microscopic images showing different sizes of tongues of fibrotic tissue (F) from the epicardium (left) towards the endocardium (right) interspersed with viable tissue (V) stained by Masson trichrome. The difference in fibrotic tissue sizes seen in C and D is most likely related to the differences in diameters of obstructed microvessels.