Figures & data
Figure 1. Regional division of the right atrium in pig 1. The right atrium was divided into 7 regional areas: sinoatrial node region; anterior and posterior wall; lateral free wall; right atrial side of the interatrial septum; right atrial appendage; tricuspid annulus.
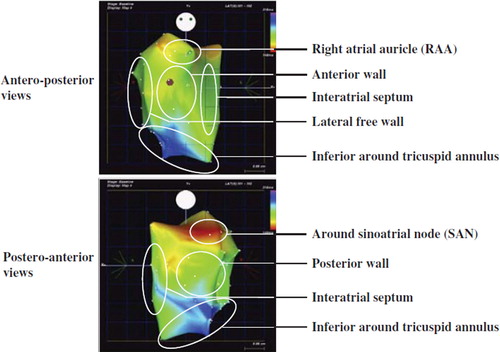
Figure 2. Example screen captures from the CARTO MAP mapping system. Left: Sample window of the CARTO system showing simultaneous recordings of the time reference electrogram from coronary sinus (upper tracing), the monophasic action potential (MAP, middle tracing) and the surface ECG (lower tracing) from pig 1 (time scale 100 mm/s). On the MAP recording, the first annotation line (F, red) was set at the onset of the rapid phase of the MAP upstroke, representing the regional activation and the second line (S, yellow) at the 90% repolarization point, representing the local end of repolarization. The MAP duration is the time interval between the two annotation lines. Right: Typical MAP recordings from pig 4 (upper tracing), pig 7 (middle tracing) and pig 5 (lower tracing), time scale 50 mm/s. Note that MAP recordings from Pig 7 (middle tracing) are from a lower site near the tricuspid annulus and contain a contaminant of QRS complex; however, the measurement of MAP intervals is not influenced.
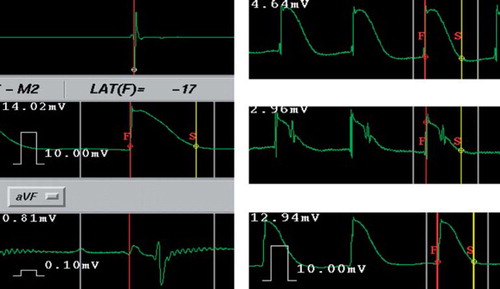
Table I. Mean value and maximal dispersions of AT, MAPd and EOR among global and regional recordings.
Table II. Maximum dispersions of AT, MAPd and EOR among all the sites and between two remote regions.