744
Views
1
CrossRef citations to date
0
Altmetric
Original Article

The Wedensky test predicts malignant ventricular arrhythmias after myocardial infarction

, , , &
Pages 256-262 | Received 20 Mar 2013, Accepted 29 Jul 2013, Published online: 19 Sep 2013

Figures & data

Table I. Demographics and clinical characteristics.

Table II. Differences between the WMI positive and negative groups.

Figure 1. Kaplan–Meier survival curves showing event incidence in patients who were WMI positive (red curves) compared with WMI negative patients (blue curves). Numbers of patients at risk and patient events are shown below each panel. In each panel, the log-rank p value is shown. Top left panel—comparison of WMI-R positive versus negative; Top right panel—comparison of WMI-T positive versus negative; Bottom left panel—comparison of WMI-RT positive versus negative; Bottom right panel—comparison of both WMI-R and WMI-T positive versus one (but not both) of the WMI-R and WMI-T positive versus both WMI-R and WMI-T negative.

Figure 1. Kaplan–Meier survival curves showing event incidence in patients who were WMI positive (red curves) compared with WMI negative patients (blue curves). Numbers of patients at risk and patient events are shown below each panel. In each panel, the log-rank p value is shown. Top left panel—comparison of WMI-R positive versus negative; Top right panel—comparison of WMI-T positive versus negative; Bottom left panel—comparison of WMI-RT positive versus negative; Bottom right panel—comparison of both WMI-R and WMI-T positive versus one (but not both) of the WMI-R and WMI-T positive versus both WMI-R and WMI-T negative.

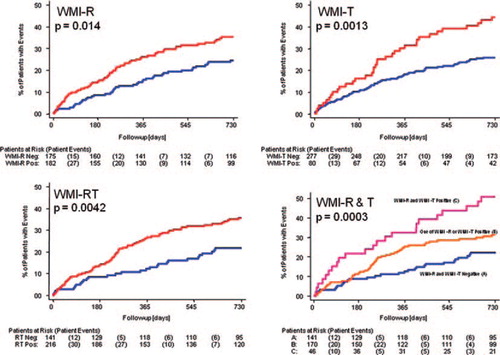
Table III. Predictive capabilities in Primary/Secondary subpopulations of Weibull model.