Figures & data
Figure 1. Animal experimental protocols and groups. All rats were divided into 3 groups (n = 6 per group): Sham, receiving 90 min perfusion; Control, exposed to 30 min ischemia (I, dark bar) followed by 60 min reperfusion (R, open bar); POST given three episodes of 30 s of global ischemia, each separated by 30 s of reperfusion before 60 min reperfusion. The coronary effluent over 10 min perfusion or reperfusion (straight line) was collected for stem cell culture.
Table I. The hemodynamic variables during the experiments.
Figure 2. Assessment of myocardial damage and ELISA assay in coronary effluent. A: Activities of CKMB and LDH at baseline, 30 min and 60 min reperfusion. All values are expressed as mean ± SD (n = 6). *P < 0.01 vs. Sham; †P < 0.01 vs. Control. B: Activities of TNF-α, IL-1β and IL-10. *P < 0.01 vs. Control. LDH, lactate dehydrogenase; CKMB, MB isoenzyme of creatine kinase; R30, 30 min of reperfusion; R60, 60 min of reperfusion; TNF, tumor necrosis factor; IL, interleukin.
Figure 3. Multiple differentiation of rat cultured BMSCs (original amplification: × 200). A: After 14 days of induction, adipogenesis was indicated by the accumulation of neutral lipid vacuoles with oil red O staining. B: After 21 days of induction, osteogenesis was indicated by a mass of red calcium salinity accumulation with alizarin red staining.
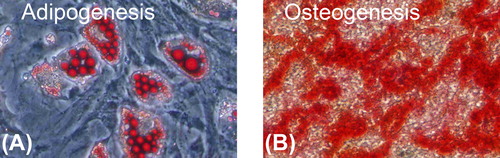
Figure 4. Quantitative analysis of stem cell proliferation by MTT under hypoxia in vitro. All values are expressed as mean ± SD (n = 3). *P < 0.01 versus 6 h. †P < 0.01 versus Control.
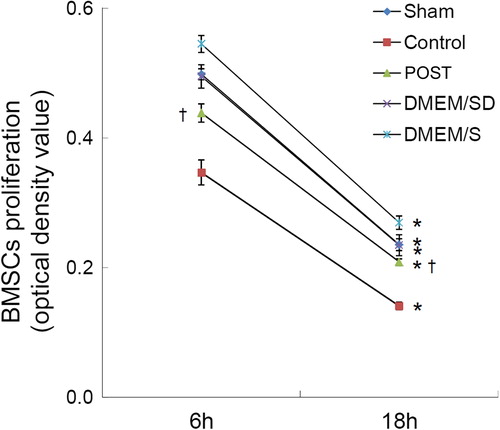
Figure 5. Improved survival of BMSCs by POST with FACS analysis under hypoxia. Flow cytometric analysis differentiates normal (living) cells with low Annexin and low PI staining, apoptotic cells with high Annexin and low PI staining, and necrotic cells with high Annexin and high PI staining. FACS, fluorescence-activated cell sorter.
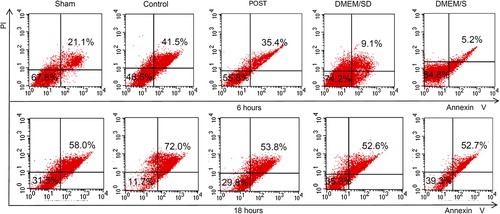
Figure 6. FACS analysis of apoptosis of BMSCs after staining with Annexin-V-FIFC and propidium iodide (also see ) All values are expressed as mean ± SD (n = 3). *P < 0.05 versus Control. FACS, fluorescence-activated cell sorter.