
Figures & data
Table I. Inclusion and exclusion criteria.
Figure 1. Three-dimensional representation of epicardial fat volume (result of the semiautomatic computation).
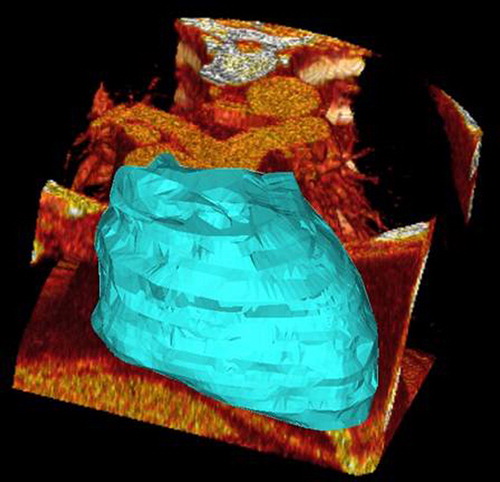
Table II. Principal characteristics of the study population.
Figure 2. Epicardial fat differences between smokers and non-smokers. Boxes show median, 25th and 75th percentile; whiskers are 5th and 95th percentile.
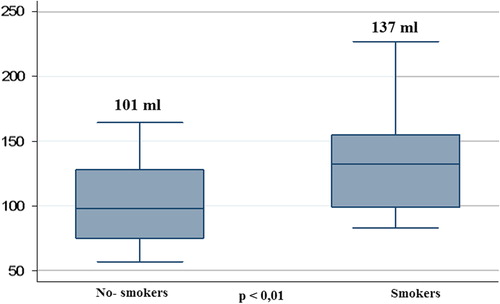
Figure 3. Dot plot showing the calcium score values in the group of smokers and non-smokers.
Table III. Multiple regression model for the prediction of calcium score (dependent variable).
Table IV. Multiple regression model for the prediction of epicardial fat (dependent variable).