Figures & data
Figure 1. Questionnaire regarding adverse effects of β-blockers.
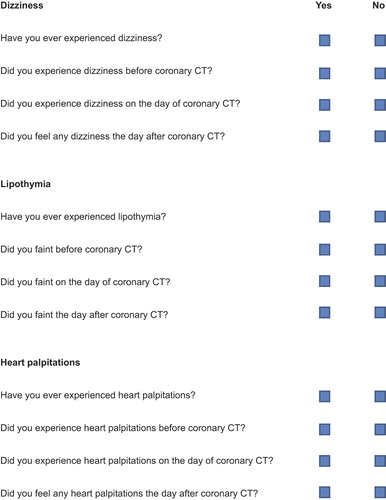
Table I. Characteristics of participants.
Table II. Possible side effects of β-blocker pretreatment.
Table III. Baseline post-procedural levels of s-creatinine and eGFR.
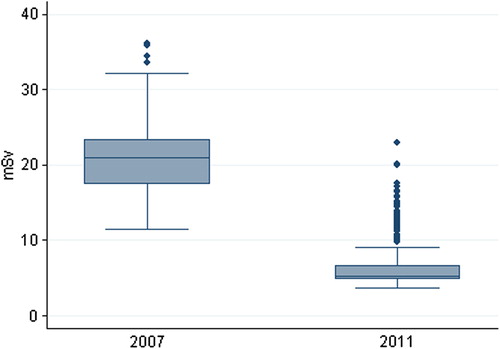
Figure 2. Box plot of radiation exposure. The box represents the 25th and 75th percentile; the middle line represents the median and the peripheral lines extend to the outer fences which are 1.5 times the interquartile range below and above the 25th and 75th percentile, respectively. The dots are outliers.