Figures & data
Figure 1. Expression of human Hep Ag in fetal hepatocytes. Fetal hepatocytes were examined for expression of various liver-specific markers, such as ALB, AFP, c-Met, CK8, CK18 and CK19, using immunocytochemistry. First row: negative control slides in which anti-goat, -rabbit and -mouse secondary antibodies were used without primary antibodies. Magnification 40 ×. Second row: expression of ALB, AFP and c-Met in fetal liver cells detected (green staining) by immunofluorescence staining. Magnification 40 ×. Third row: fetal hepatocyte colonies expressing CK8, CK18 and CK19 (green staining). Magnification 40 ×.
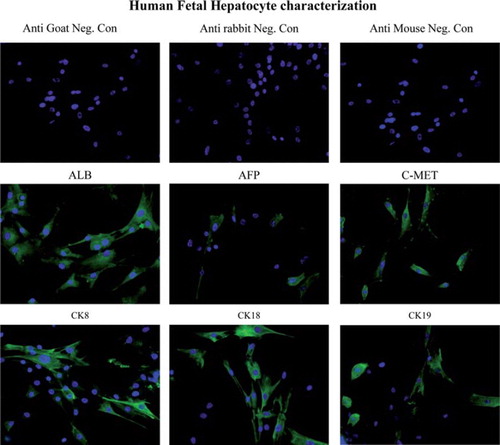
Figure 2. Phenotypic analysis of fetal liver MSC. (A). The expression of hepatocyte-specific markers such as ALB, CK8, CK18, CK19, c-Met and Hep Ag in hFLMSC was examined by immunocytochemistry. First row: negative controls, anti-goat and -mouse secondary antibodies. ALB staining was not detected in hFLMSC. Cells expressing CK8 (brown staining) were detected. Magnification 40 ×. Second row: expression of CK18 (brown staining) was detected. A few cells expressed c-Met. hFLMSC did not express CK19 and Hep Ag. Magnification 40 ×. (B) hFLMSC were characterized with regard to expression of CD44, CD106, CD29, CD45, CD73, CD166, CD54 and CD34 using flow cytometry. First row: hFLMSC showed strong expression of CD44 and weak expression of CD29. Expression of CD106 and CD45 was not observed. Second row: expression of CD73, CD166 and CD54 was strong on hFLMSC, while expression of CD34 was not detected.
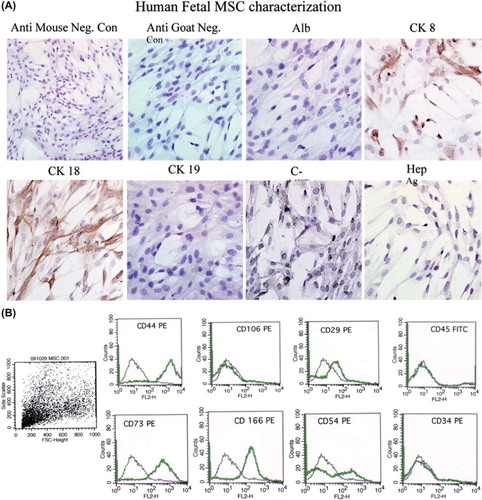
Figure 3. Detection of cytokines in hFLMSC culture supernatants. The levels of common cytokines in human hFLMSC culture supernatants were assessed using ELISA. Supernatants showed high levels of IL-6 and IL-8, while low levels of IL-1α, IL-1β and GM-CSF were detected.
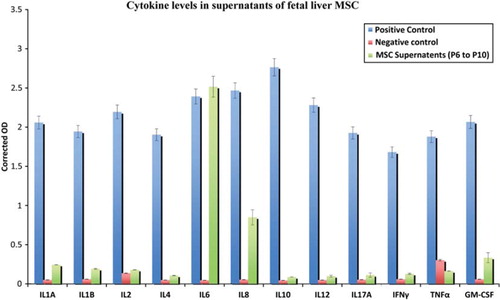
Table I. Cell lysates of hFH, mesenchymal cells and adult hepatocytes were analyzed with regard to ammonia and urea content, and SOD activity.
Figure 4. Transplantation of hFH and fetal liver MSC in nude mice. The FHTx group received 2 million hFH, the CoTx group received 1 million hFH and 1 million hFLMSC, and the MTx group received 2 million hFLMSC. Cells were transplanted into the spleen of retrorsine-treated nude mice that underwent 40% partial hepatectomy at the time of transplantation. Paraffin-embedded sections stained with human DNA-specific probe (FISH) showed the presence of human cells (red signals). Nuclei were counterstained with DAPI (blue). Immunohistochemistry was performed on freshly frozen liver sections from FHTx, CoTx and MTx groups, to detect human ALB staining (green staining). Paraffin-embedded sections were stained for human-specific AFP nuclear antigen. Biopsy of liver cancer served as a positive control and a sham group as a negative control. Hematoxylin (HE) counterstained. Magnification 40 ×.
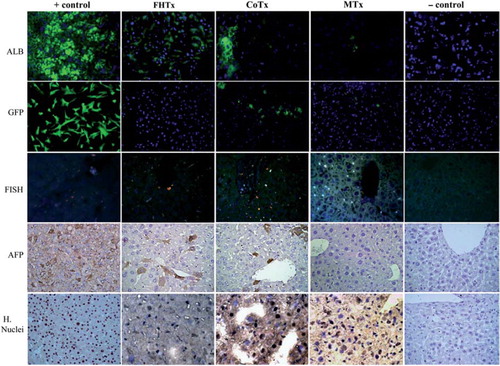
Figure 5. Transplantation of hFH and hFLMSC in nude mice. Paraffin-embedded sections were stained for human c-Met, CK8, CK18, CK19, mitochondrial antigen and hepatocyte antigen. Engrafted human cells stained dark brown. Biopsy sections from patients with liver cancer served as a positive control and a sham group as a negative control. HE counterstained. Magnification 40 ×. Paraffin-embedded sections were stained for human-specific AFP nuclear antigen. Biopsy of liver cancer served as a positive control and a sham group as a negative control. HE counterstained. Magnification 40 ×.
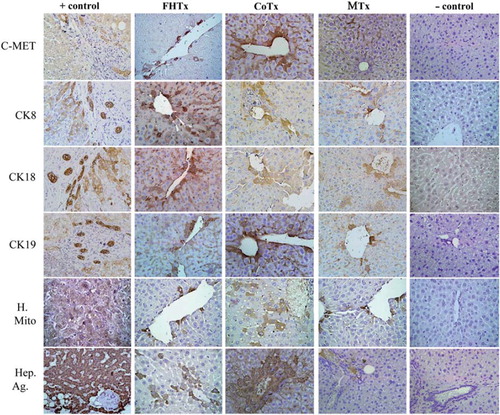
Figure 6. Human hepatocyte-specific gene expression as detected by RT-PCR and quantification of engrafted cells. (A) Expression of CK19, ALB, AFP, HNF-1α, HNF-1β, HNF-4α and CYP3A7 mRNA was analyzed by RT-PCR of mouse livers after transplantation. The detoxifying enzyme CYP3A7 transcript and human-specific CK19, ALB, AFP, HNF-1α, HNF-1β and HNF-4α were specifically expressed in CoTx mouse livers. (B) Engrafted cells in the FHTx, CoTx and MTx groups were counted manually from five different liver regions and presented in cells in cm/mm3. Cells positive for human nuclei and ALB were highest in the CoTx group. GFP+ cells were highest in the MTx group.
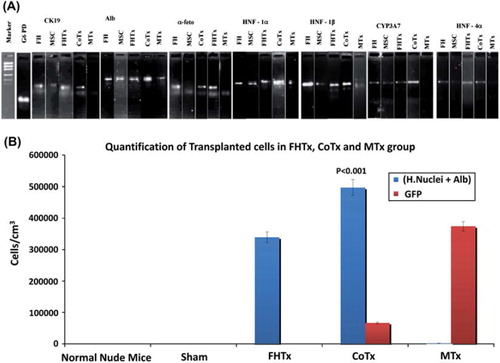
Table II. Human ALB and soluble human c-Met concentrations in various groups.
Table III. Quantification of engrafted human cells in livers of nude mice with acute liver injury.