660
Views
10
CrossRef citations to date
0
Altmetric
Research Article

Tautomeric forms study of 1H-(2′-pyridyl)-3-methyl-5-hydroxypyrazole and 1H-(2′-pyridyl)-3-phenyl-5-hydroxypyrazole. Synthesis, structure, and cytotoxic activity of their complexes with palladium(II) ions

, , , , , & show all
Pages 1257-1268 | Received 13 Nov 2008, Accepted 10 Feb 2009, Published online: 16 Nov 2009

Figures & data

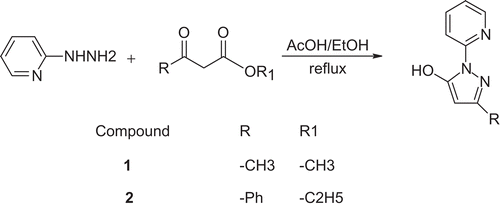
Scheme 1. Synthesis of compounds 1 and 2.

Scheme 1. Synthesis of compounds 1 and 2.

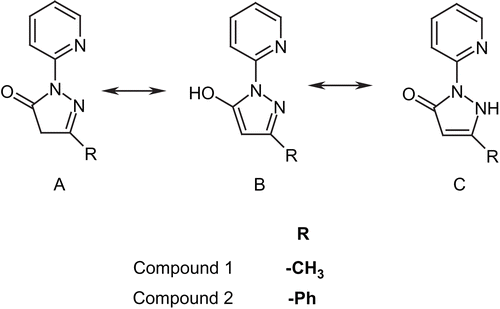
Scheme 2. Tautomeric forms of compounds 1 and 2.

Scheme 2. Tautomeric forms of compounds 1 and 2.

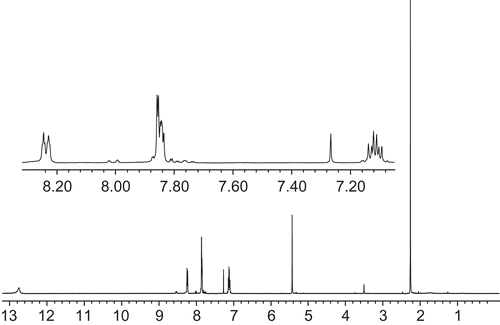
Figure 1. 1H NMR spectrum of compound 1.

Figure 1.  1H NMR spectrum of compound 1.

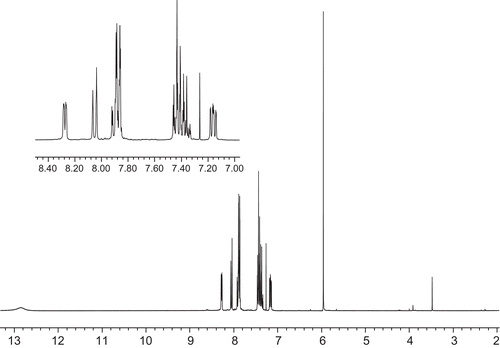
Figure 2. 1H NMR spectrum of compound 2.

Figure 2.  1H NMR spectrum of compound 2.

Table 1. Percentage of tautomeric forms in solution calculated from 1H NMR.

Figure 3. Calculated structures of the lowest energy conformers of each tautomer of 1 in the gas phase with selected dihedral angles (°).
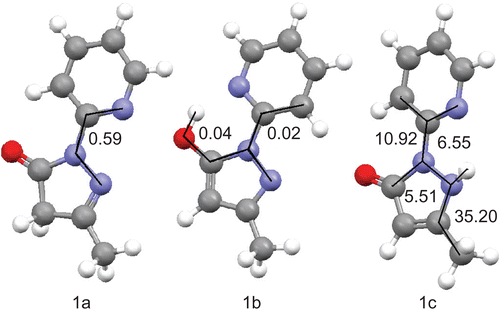
Figure 3.  Calculated structures of the lowest energy conformers of each tautomer of 1 in the gas phase with selected dihedral angles (°).

Figure 4. Calculated structures of the lowest energy conformers of each tautomer of 2 in the gas phase with selected dihedral angles (°).
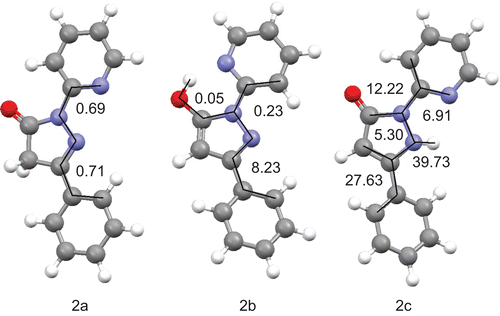
Figure 4.  Calculated structures of the lowest energy conformers of each tautomer of 2 in the gas phase with selected dihedral angles (°).

Table 2. Enthalpy and percentage of tautomers calculated at B3LYP/6-31+G(d,p) level of theory.

Table 3. Gibbs free energy and percentage of tautomers calculated at B3LYP/6-31+G(d,p) level of theory.

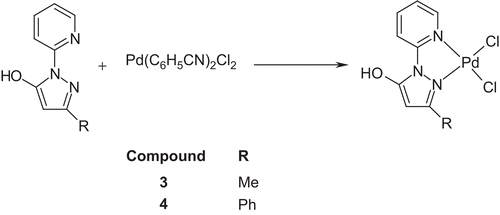
Scheme 3. Synthesis of complexes 3 and 4.

Scheme 3.  Synthesis of complexes 3 and 4.

Figure 5. ORTEP view of molecular structure of Pd(II) compound 3 with atom numbering scheme and ellipsoids at 30% probability level.
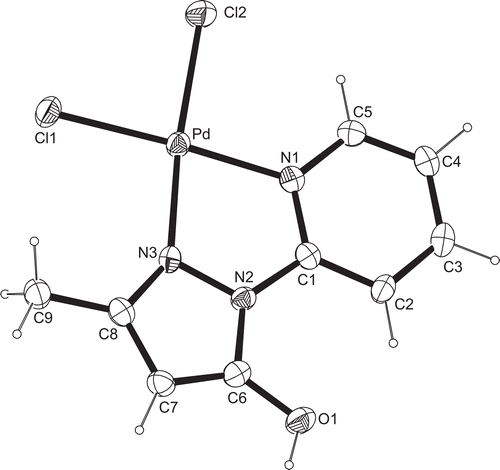
Figure 5.  ORTEP view of molecular structure of Pd(II) compound 3 with atom numbering scheme and ellipsoids at 30% probability level.

Figure 6. ORTEP view of molecular structure of Pd(II) compound 4 with atom numbering scheme and ellipsoids at 30% probability level.
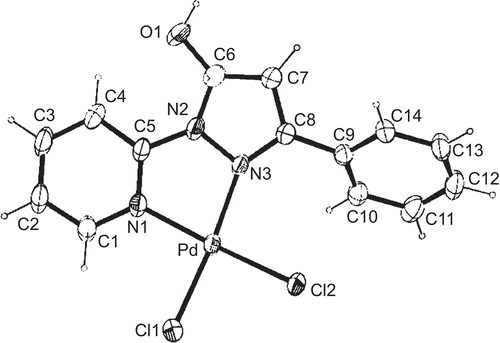
Figure 6.  ORTEP view of molecular structure of Pd(II) compound 4 with atom numbering scheme and ellipsoids at 30% probability level.

Figure 7. Comparison of compound 3 structures from X-ray crystallography (gray scale) and DFT calculations (black).
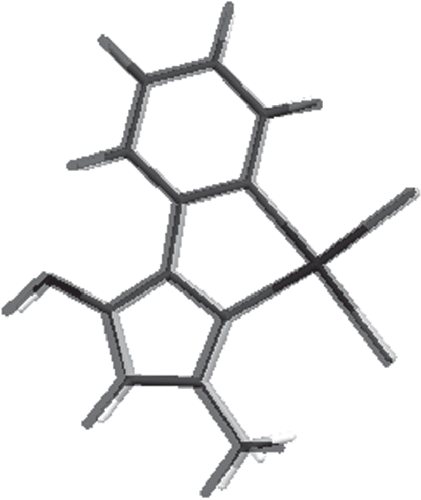
Figure 7.  Comparison of compound 3 structures from X-ray crystallography (gray scale) and DFT calculations (black).

Figure 8. Comparison of compound 4 structures from X-ray crystallography (gray scale) and DFT calculations (black).
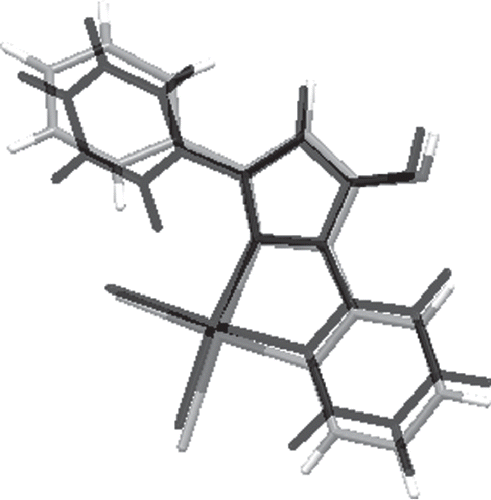
Figure 8.  Comparison of compound 4 structures from X-ray crystallography (gray scale) and DFT calculations (black).

Table 4. IC50 values of tested compounds.

Reprints and Corporate Permissions

Please note: Selecting permissions does not provide access to the full text of the article, please see our help page How do I view content?

To request a reprint or corporate permissions for this article, please click on the relevant link below:

Academic Permissions

Please note: Selecting permissions does not provide access to the full text of the article, please see our help page How do I view content?

Obtain permissions instantly via Rightslink by clicking on the button below:

If you are unable to obtain permissions via Rightslink, please complete and submit this Permissions form. For more information, please visit our Permissions help page.