Figures & data
Scheme 1. Chemical structures of functionalized alkyl-organotellurides A, B, C, and D.
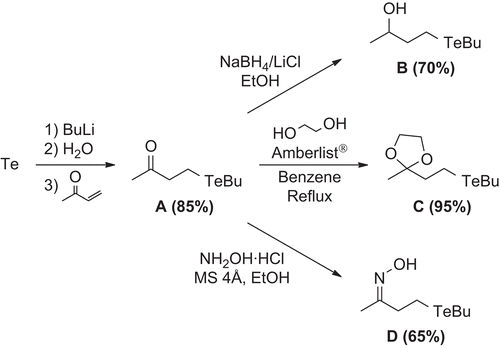
Figure 1. Effect of A (0.1–5 µM) (a), B (0.1–1 µM) (b), C (0.001– 1µM) (c), and D (0.1–1 µM) (d) on lipid peroxidation induced with Fe2+/EDTA. Data are reported as mean ± SD for four independent experiments, each one in duplicate. *, Denotes p < 0.05 as compared to the sample with Fe2+/EDTA (one-way ANOVA/Duncan). #, Denotes p < 0.05 as compared to control values (without Fe2+/EDTA and compounds) (one-way ANOVA/Duncan).
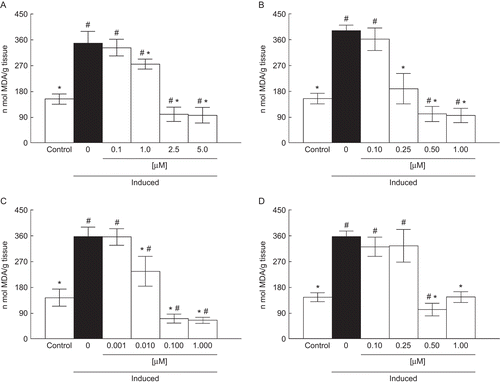
Table 1. Calculated IC50 values (µM) for lipid peroxidation and protein carbonyl content of functionalized alkyl-organotellurides in rat liver.
Figure 2. Effect of A (0.1–1 µM) (a), B (0.01–1 µM) (b), C (0.001–1 µM) (c), and D (0.1–1 µM) (d) on lipid peroxidation induced with SNP. Data are reported as mean ± SD for four independent experiments, each one in duplicate. *, Denotes p < 0.05 as compared to sample with SNP (one-way ANOVA/Duncan). #, Denotes p < 0.05 as compared to control values (without SNP and compounds) (one-way ANOVA/Duncan).
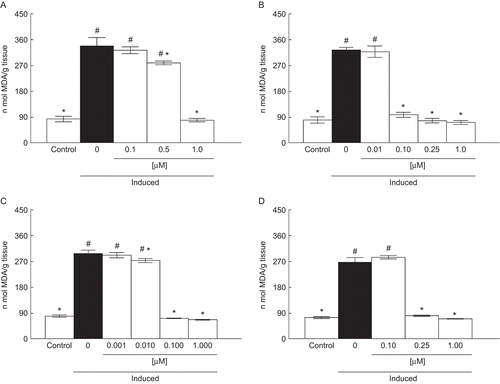
Figure 3. Effect of A (0.1–1 µM) (a), B (0.1–1 µM) (b), C (0.001–1 µM) (c), and D (0.1–1 µM) (d) on protein carbonyl content. Data are reported as mean ± SD for four independent experiments, each one in duplicate. *, Denotes p < 0.05 as compared to the sample with SNP (one-way ANOVA/Duncan). #, Denotes p < 0.05 as compared to control values (without SNP and compounds) (one-way ANOVA/Duncan).
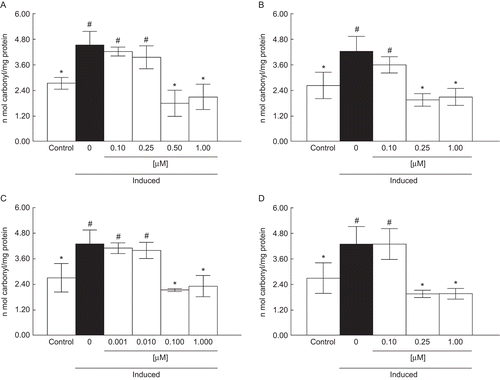
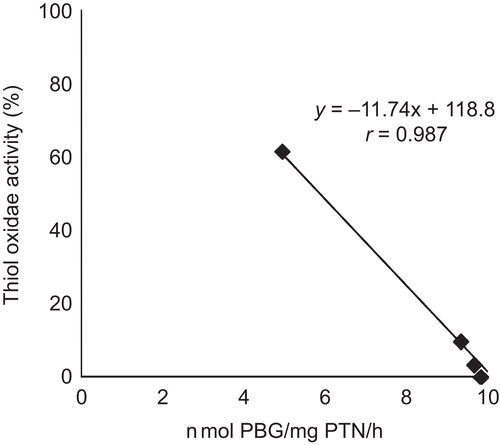
Figure 4. Correlation between thiol oxidase property and δ-ALA-D activity of alkyl-organotelluride A.