542
Views
5
CrossRef citations to date
0
Altmetric
Research Article

Molecular modeling and biological effects of peptidomimetic inhibitors of TACE activity

, , &
Pages 459-466 | Received 20 Oct 2008, Accepted 20 Aug 2009, Published online: 01 Dec 2009

Figures & data

Figure 1. Chemical structures of lead compound 1 and modified compounds 8a–d with molecular weight (MW), melting point (m.p.), and yield percentage. Ala, l-alanine; Phe, l-3-phenylalanine; Nal, l-3-(2’-naphthyl)alanine.
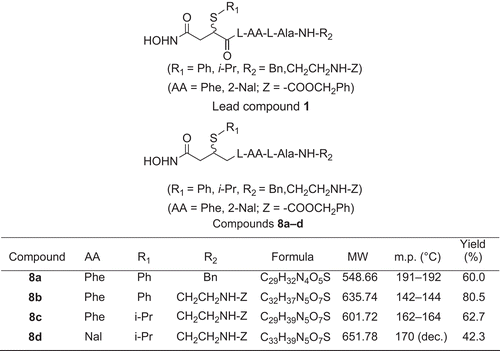
Figure 1.  Chemical structures of lead compound 1 and modified compounds 8a–d with molecular weight (MW), melting point (m.p.), and yield percentage. Ala, l-alanine; Phe, l-3-phenylalanine; Nal, l-3-(2’-naphthyl)alanine.

Figure 2. Synthesis of 8a–d. Reagents and conditions: (a) i-PrOH; (b) R1SH/Et3N, benzene; (c) Z-Cl (PhCH2OCOCl); (d) Boc-l-AlaOH, HOBt/DCC, H2NCH2Ph; (e) TFA, Boc-l-AA-OH, HOBt/DCC/Et3N; (f) TFA, HOBt/DCC/Et3N; (g) HONH2/MeOH.
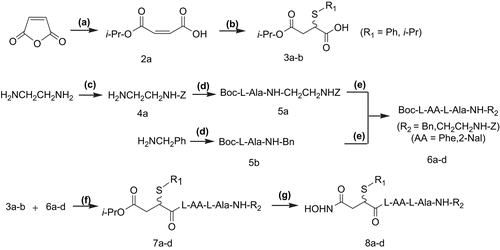
Figure 2.  Synthesis of 8a–d. Reagents and conditions: (a) i-PrOH; (b) R1SH/Et3N, benzene; (c) Z-Cl (PhCH2OCOCl); (d) Boc-l-AlaOH, HOBt/DCC, H2NCH2Ph; (e) TFA, Boc-l-AA-OH, HOBt/DCC/Et3N; (f) TFA, HOBt/DCC/Et3N; (g) HONH2/MeOH.

Table 1. Effects of inhibitors on LPS-induced sTNF-α secretion by HL-60.

Figure 3. Content assay of mTNF-α on peritoneal macrophage surfaces of LPS-treated mice by FCM. (A) 0.1 mL PBS (blank control); (B) PBS + Tween-80 (solvent control); (C) Tween-80 containing 1.5 mg of compound 8d; (D) Tween-80 containing 2.5 mg of compound 8d; (A–D) i.p. injection of the above solutions, respectively, followed by intracaudate injection of 0.1 mL solution containing 10 mg d-GalN and 0.4–2 μg LPS; (E) intracaudate injection of 0.1 mL solution containing 10 mg d-GalN and 0.4–2 μg LPS only (positive control).
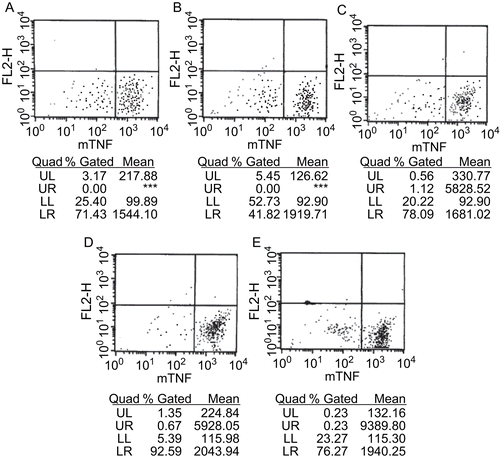
Figure 3.  Content assay of mTNF-α on peritoneal macrophage surfaces of LPS-treated mice by FCM. (A) 0.1 mL PBS (blank control); (B) PBS + Tween-80 (solvent control); (C) Tween-80 containing 1.5 mg of compound 8d; (D) Tween-80 containing 2.5 mg of compound 8d; (A–D) i.p. injection of the above solutions, respectively, followed by intracaudate injection of 0.1 mL solution containing 10 mg d-GalN and 0.4–2 μg LPS; (E) intracaudate injection of 0.1 mL solution containing 10 mg d-GalN and 0.4–2 μg LPS only (positive control).

Figure 4. Hematoxylin and eosin (HE) staining of liver and kidney before and after injection of LPS, inhibitor 8d (×200). (A) LPS in liver; (B) LPS and 8d (2.5 mg) in liver; (C) LPS in kidney; (D) LPS and 8d (2.5 mg) in kidney.
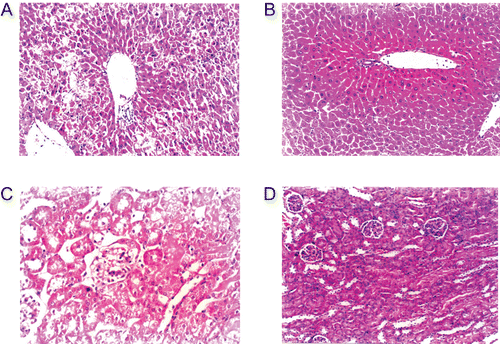
Figure 4.  Hematoxylin and eosin (HE) staining of liver and kidney before and after injection of LPS, inhibitor 8d (×200). (A) LPS in liver; (B) LPS and 8d (2.5 mg) in liver; (C) LPS in kidney; (D) LPS and 8d (2.5 mg) in kidney.

Figure 5. Resultant conformation after molecular docking between inhibitor 8c and TACE on SCI Octane 2 graph workstation using advanced Insight II 2003.3L molecular modeling software.
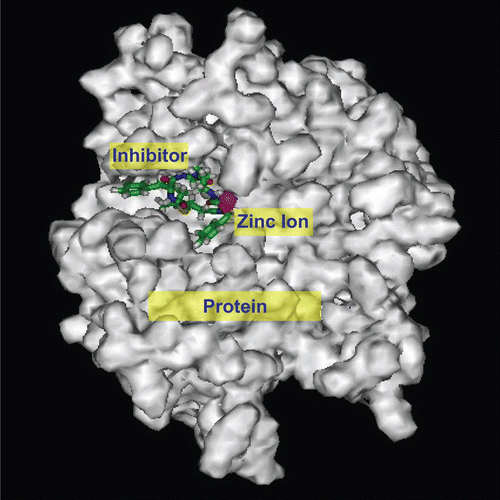
Figure 5.  Resultant conformation after molecular docking between inhibitor 8c and TACE on SCI Octane 2 graph workstation using advanced Insight II 2003.3L molecular modeling software.

Table 2. Comparison of nonbonding interaction energies between four inhibitors (8a–d) and TACE with results of cell experiments.

Reprints and Corporate Permissions

Please note: Selecting permissions does not provide access to the full text of the article, please see our help page How do I view content?

To request a reprint or corporate permissions for this article, please click on the relevant link below:

Academic Permissions

Please note: Selecting permissions does not provide access to the full text of the article, please see our help page How do I view content?

Obtain permissions instantly via Rightslink by clicking on the button below:

If you are unable to obtain permissions via Rightslink, please complete and submit this Permissions form. For more information, please visit our Permissions help page.