Figures & data
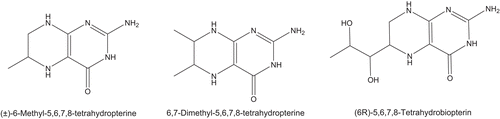
Scheme 1. Chemical structures of the tetrahydropterines used in this work.
Scheme 2. Kinetic mechanism to explain the pterin oxidase pathway and suicide inactivation pathway of tyrosinase in its action on tetrahydropterines.
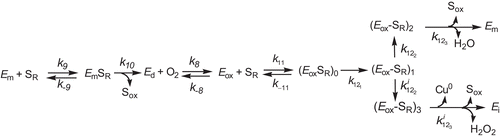
Figure 1. Corrected recordings of the appearance of MBH 2 in the suicide inactivation of tyrosinase (TYR) by MBH4 for different enzyme concentrations. Conditions were 30 mM sodium phosphate buffer (pH 7.0), ![]()
![Figure 1. Corrected recordings of the appearance of MBH 2 in the suicide inactivation of tyrosinase (TYR) by MBH4 for different enzyme concentrations. Conditions were 30 mM sodium phosphate buffer (pH 7.0), Display full size = 340 nm, 0.26 mM O2, 0.5 mM [MBH4]0, 414 UI/m [SOD]0, and [E]0 (µM): (a) 0.3, (b) 0.45, (c) 0.5, (d) 0.6, (e) 0.7, and (f) 0.8. Inset A. Representation of the values of [MBH2]∞ (•) and Display full size(O) vs. enzyme concentration. Inset B. Representation of absorbance at λ = 340 nm with time in the reaction of TYR on BH2. The experimental conditions were 30 mM sodium phosphate buffer (pH = 7.0), 25°C, [BH2]0 = 0.2 mM and [E]0 = 0.1 µM.](/cms/asset/d9a6dbef-565e-4f29-b492-a811988bd9eb/ienz_a_548811_f0003_b.gif)
Table 1. Kinetic constants which characterize the suicide inactivation of tyrosinase by tetrahydropterines.
Figure 2. Representations of the values of ![]()
![Figure 2. Representations of the values of Display full sizevs. enzyme concentration for the different substrates studied (BH4 •, MBH4 O and DMBH4 ▴). Experimental conditions were 30 mM sodium phosphate buffer (pH 7.0), 25°C and 414 UI/ml [SOD]0. The substrates studied were recorded from the appearance of product. The initial concentration for every substrate was 0.8 mM. In every substrate, (—) linear regression fitting of the experimental data points.](/cms/asset/b3d8bd06-f47d-4498-8afd-2895bfb50337/ienz_a_548811_f0004_b.gif)
Figure 3. Corrected recordings of the appearance of MBH 2 in the suicide inactivation of TYR by different MBH4 concentrations. Conditions were 30 mM sodium phosphate buffer (pH 7.0), 0.26 mM O2, λ = 340 nm, 0.6 µM [TYR]0, and 414 UI/ml [SOD]0. The substrate concentrations were (mM): (a) 0.2, (b) 0.3, (c) 0.4, (d) 0.5, (e) 0.6, (f) 0.7, and (g) 0.8. Inset. Values of ![]()
![Figure 3. Corrected recordings of the appearance of MBH 2 in the suicide inactivation of TYR by different MBH4 concentrations. Conditions were 30 mM sodium phosphate buffer (pH 7.0), 0.26 mM O2, λ = 340 nm, 0.6 µM [TYR]0, and 414 UI/ml [SOD]0. The substrate concentrations were (mM): (a) 0.2, (b) 0.3, (c) 0.4, (d) 0.5, (e) 0.6, (f) 0.7, and (g) 0.8. Inset. Values of Display full size vs. [MBH2]0.](/cms/asset/6ee3d455-110d-4c30-80ea-b90fcf1689d6/ienz_a_548811_f0005_b.gif)
Figure 4. Representation of the values of the inactivation constant ![]()
![Figure 4. Representation of the values of the inactivation constant Display full size vs. [SR]0 for the different substrates studied. Conditions were 30 mM sodium phosphate buffer (pH 7.0), 25°C. Every substrates were recorded from the appearance of product (BH2, MBH2, and DMBH2 for BH4 •, MBH4 O and DMBH4 ▴, respectively). (—), Non-linear regression fitting to Eq. (4) of the data analysis. Enzyme concentration was, in each case, 0.6 µM. The initial concentration of superoxide dismutase (SOD) was 414 UI/ml.](/cms/asset/61334fa1-b762-464c-bc41-947c077ce538/ienz_a_548811_f0006_b.gif)
Figure 5. •Suicide inactivation kinetics of TYR in its action on DMBH4. The process was followed by measuring the residual diphenolase activity of the enzyme with time. The experimental conditions were 30 mM sodium phosphate buffer (pH 7.0), [O2]0 = 0.26 mM, [TYR]0 = 0.61 µM, [SOD]0 = 414 UI/ml, and [DMBH4] = 0.8 mM. Aliquots were taken at various times to measure the residual activity with 2.5 mM L-dopa (wavelength 475 nm). ▴Suicide inactivation kinetics of TYR in its action on DMBH2. The process was followed by measurement of the residual monophenolase activity of the enzyme with time. The experimental conditions were 30 mM phosphate buffer (pH 7.0), [O2]0 = 0.26 mM, [TYR]0 = 0.61 µM, [SOD]0 = 414 UI/ml, and [DMBH4] = 0.8 mM. Aliquots were taken at various times to measure the residual activity with 1 mM L-tyrosine and 46 µM L-DOPA (wavelength 475 nm). L-DOPA was added to eliminate the lag phase of the monophenolase activity of TYR.
![Figure 5. •Suicide inactivation kinetics of TYR in its action on DMBH4. The process was followed by measuring the residual diphenolase activity of the enzyme with time. The experimental conditions were 30 mM sodium phosphate buffer (pH 7.0), [O2]0 = 0.26 mM, [TYR]0 = 0.61 µM, [SOD]0 = 414 UI/ml, and [DMBH4] = 0.8 mM. Aliquots were taken at various times to measure the residual activity with 2.5 mM L-dopa (wavelength 475 nm). ▴Suicide inactivation kinetics of TYR in its action on DMBH2. The process was followed by measurement of the residual monophenolase activity of the enzyme with time. The experimental conditions were 30 mM phosphate buffer (pH 7.0), [O2]0 = 0.26 mM, [TYR]0 = 0.61 µM, [SOD]0 = 414 UI/ml, and [DMBH4] = 0.8 mM. Aliquots were taken at various times to measure the residual activity with 1 mM L-tyrosine and 46 µM L-DOPA (wavelength 475 nm). L-DOPA was added to eliminate the lag phase of the monophenolase activity of TYR.](/cms/asset/a423f744-52e2-48de-854e-d596e51cc36d/ienz_a_548811_f0007_b.gif)