8,180
Views
5
CrossRef citations to date
0
Altmetric
Research Article

Famotidine inhibits glycogen synthase kinase-3β: An investigation by docking simulation and experimental validation

, , , , , , & show all
Pages 690-694 | Received 25 Dec 2011, Accepted 25 Feb 2012, Published online: 18 Apr 2012

Figures & data

Figure 1.  Molecular structure of both Cimitidine (I) and Famotidine (II).

Figure 1.  Molecular structure of both Cimitidine (I) and Famotidine (II).

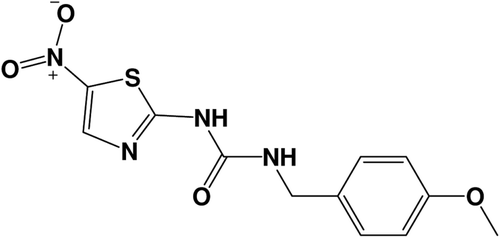
Figure 2.  Molecular structure of co-crystallized structure AR-A014418.

Figure 2.  Molecular structure of co-crystallized structure AR-A014418.

Figure 3.  (A) Detailed view of the co-crystallized structure (AR-A014418) and the corresponding interacting amino-acids within the binding site of GSK-3β. (B) Detailed view of the docked famotidine structure and the corresponding interacting amino-acid moieties within the binding site of GSK-3β.
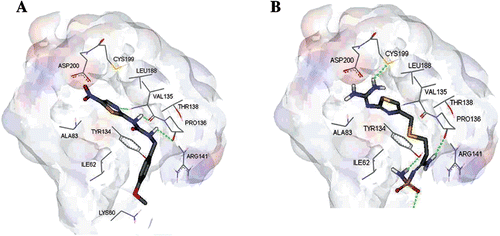
Figure 3.  (A) Detailed view of the co-crystallized structure (AR-A014418) and the corresponding interacting amino-acids within the binding site of GSK-3β. (B) Detailed view of the docked famotidine structure and the corresponding interacting amino-acid moieties within the binding site of GSK-3β.

Figure 4.  Comparison between the docked conformer/pose of inhibitor AR-A014418 (dark black) as produced by the docking simulation and the crystallographic structure of this inhibitor within GSK-3β (gray, PDB code: 1Q5K).
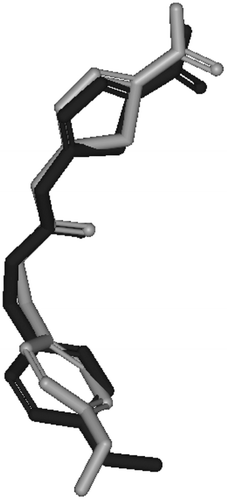
Figure 4.  Comparison between the docked conformer/pose of inhibitor AR-A014418 (dark black) as produced by the docking simulation and the crystallographic structure of this inhibitor within GSK-3β (gray, PDB code: 1Q5K).

Figure 5.  Liver glycogen reserves in fasting 10-week old male Balb/c mice three hours after i.p. administration of vehicle control, 1.1, 2.2 and 4.4 mg/kg of famotidine normalized to mice weights (20 g). Each result represents the average glycogen level from 5 mice. Error bars indicate the standard deviations of the measurements. (*) p value < 0.05 versus control.
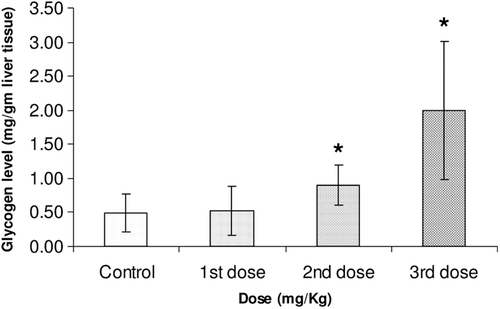
Figure 5.  Liver glycogen reserves in fasting 10-week old male Balb/c mice three hours after i.p. administration of vehicle control, 1.1, 2.2 and 4.4 mg/kg of famotidine normalized to mice weights (20 g). Each result represents the average glycogen level from 5 mice. Error bars indicate the standard deviations of the measurements. (*) p value < 0.05 versus control.

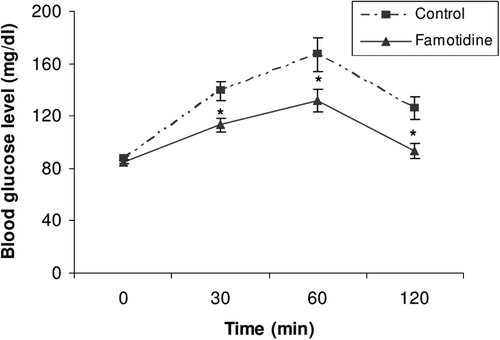
Figure 6.  Glycemic response during a 75 g OGTT (n = 6) in healthy humans with (▴) or without (▪) famotidine (80 mg p.o.). Asterisks denote a significant difference compared to the control values. Data are expressed as geometric mean ± SEM.

Figure 6.  Glycemic response during a 75 g OGTT (n = 6) in healthy humans with (▴) or without (▪) famotidine (80 mg p.o.). Asterisks denote a significant difference compared to the control values. Data are expressed as geometric mean ± SEM.

Reprints and Corporate Permissions

Please note: Selecting permissions does not provide access to the full text of the article, please see our help page How do I view content?

To request a reprint or corporate permissions for this article, please click on the relevant link below:

Academic Permissions

Please note: Selecting permissions does not provide access to the full text of the article, please see our help page How do I view content?

Obtain permissions instantly via Rightslink by clicking on the button below:

If you are unable to obtain permissions via Rightslink, please complete and submit this Permissions form. For more information, please visit our Permissions help page.