1,495
Views
5
CrossRef citations to date
0
Altmetric
Research Article

Structure-activity relationships of bergenin derivatives effect on α-glucosidase inhibition

, , &
Pages 1162-1170 | Received 28 Oct 2011, Accepted 05 Aug 2012, Published online: 26 Sep 2012

Figures & data

Figure 1.  Chemical structures of bergenin (1) and its derivatives (29).

Figure 1.  Chemical structures of bergenin (1) and its derivatives (2–9).

Scheme 1.  Reagents and conditions: (a) allylbromide, K2CO3, NaI, DMF; (b) DIAD, P(Ph)3, RCOOH, THF; (c) 10% Pd(PPh3)4, 20 equiv., morpholine, THF.

Scheme 1.  Reagents and conditions: (a) allylbromide, K2CO3, NaI, DMF; (b) DIAD, P(Ph)3, RCOOH, THF; (c) 10% Pd(PPh3)4, 20 equiv., morpholine, THF.

Scheme 2.  Reagents and conditions: (a) DIAD, P(Ph)3, 3,4-diallyloxy-protocatechuic acid, THF; (b) 10% Pd(PPh3)4, 20 equiv., morpholine, THF.
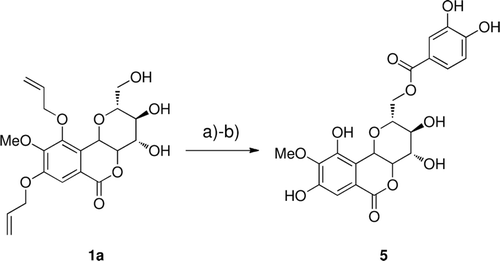
Scheme 2.  Reagents and conditions: (a) DIAD, P(Ph)3, 3,4-diallyloxy-protocatechuic acid, THF; (b) 10% Pd(PPh3)4, 20 equiv., morpholine, THF.

Table 1.  13C NMR spectral data for compounds 2–9 (δ in ppm).

Figure 2.  Dose-dependent inhibitory effects of bergenin (1) and its derivatives (29). Acarbose and 1-deoxynojirimycin were used a positive control. The result represents the means of triplicate experiments.
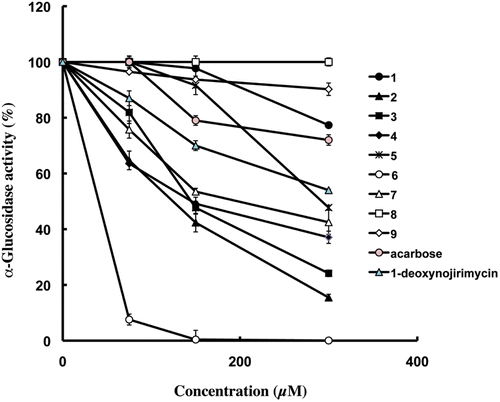
Figure 2.  Dose-dependent inhibitory effects of bergenin (1) and its derivatives (2–9). Acarbose and 1-deoxynojirimycin were used a positive control. The result represents the means of triplicate experiments.

Table 2.  Inhibition effects of bergenin (1) and bergenin derivatives (2–10) against α-glucosidase.

Figure 3.  Lineweaver–Burk plot (panel A) and Dixon plot (panel B) for inhibition of compound 2 (0, 75, 150 and 300 µM) on α-glucosidase activity.
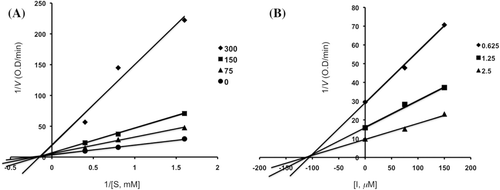
Figure 3.  Lineweaver–Burk plot (panel A) and Dixon plot (panel B) for inhibition of compound 2 (0, 75, 150 and 300 µM) on α-glucosidase activity.

Figure 4.  Lineweaver–Burk plot (panel A) and Dixon plot (panel B) for inhibition of compound 6 (0, 7.5, 15 and 30 µM) on α-glucosidase activity.
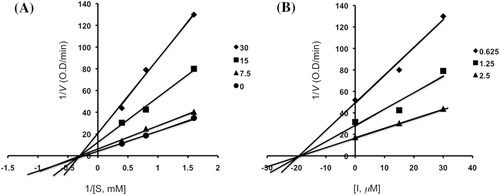
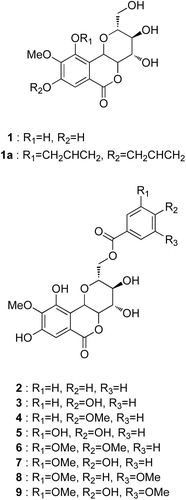
Figure 4.  Lineweaver–Burk plot (panel A) and Dixon plot (panel B) for inhibition of compound 6 (0, 7.5, 15 and 30 µM) on α-glucosidase activity.
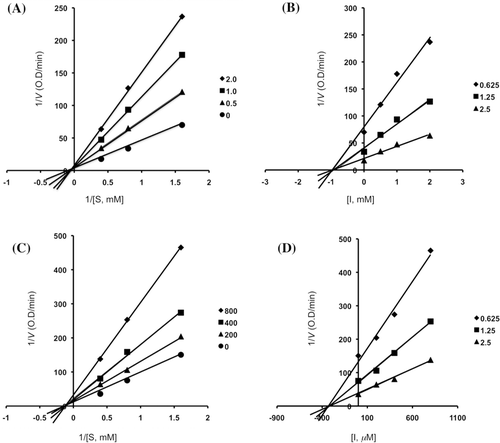
Figure 5.  Lineweaver–Burk plot (panels A and C) and Dixon plot (panels B and D) for inhibition of acarbose (0, 0.5, 1.0 and 2.0 mM) and 1-deoxynojirimycin (0, 200, 400 and 800 μM) on α-glucosidase activity.

Figure 5.  Lineweaver–Burk plot (panels A and C) and Dixon plot (panels B and D) for inhibition of acarbose (0, 0.5, 1.0 and 2.0 mM) and 1-deoxynojirimycin (0, 200, 400 and 800 μM) on α-glucosidase activity.

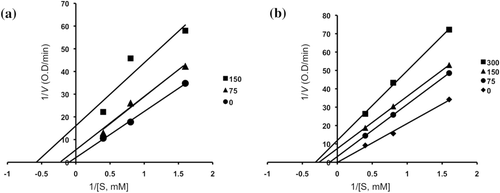
Figure 6.  Line weaver–Burk plots for the inhibition of the hydrolysis activity of α-glucosidase by compounds 3 (0, 75 and 150 mM) (a) and 4 (0, 75, 150 and 300 mM) (b).

Figure 6.  Line weaver–Burk plots for the inhibition of the hydrolysis activity of α-glucosidase by compounds 3 (0, 75 and 150 mM) (a) and 4 (0, 75, 150 and 300 mM) (b).

Reprints and Corporate Permissions

Please note: Selecting permissions does not provide access to the full text of the article, please see our help page How do I view content?

To request a reprint or corporate permissions for this article, please click on the relevant link below:

Academic Permissions

Please note: Selecting permissions does not provide access to the full text of the article, please see our help page How do I view content?

Obtain permissions instantly via Rightslink by clicking on the button below:

If you are unable to obtain permissions via Rightslink, please complete and submit this Permissions form. For more information, please visit our Permissions help page.