Figures & data
Figure 1. Chemical structure of the chlortoluron.
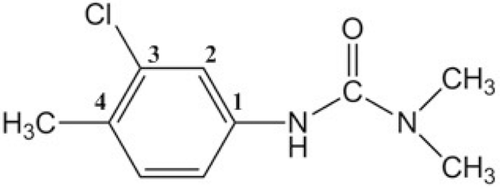
Table 1. The amino acid sequence identity.
Figure 2. Ribbon schematic representations of the refined homology models of the four P450s. Heme is shown as red stick. Major helices are labelled. Image was generated using PyMOL (http://www.pymol.org).
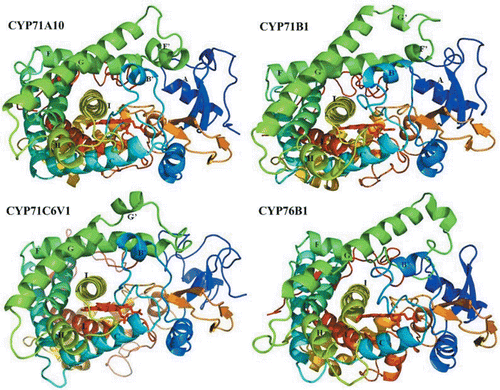
Table 2. Sequence identity scores and Ramachandran plot statistics for the four P450 models presented. Scores indicate identity with amino acid sequence of the template.
Figure 3. RMSD (A) and RMSF (B) of Ca backbone as a function of time for CYP71A10-CT (green), the CYP71B1-CT (red), CYP71C6V1-CT (black) and CYP76B1-CT (blue).
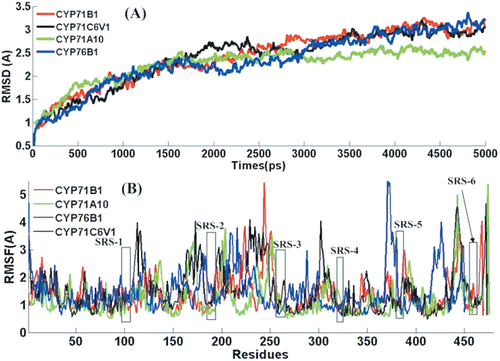
Figure 4. A close view of the binding mode of the four P450s with (A) CYP71A10, (B) CYP71B1, (C) CYP71C6V1 and (D) CYP76B1. Heme is represented by a red stick. Key residues are represented by stick, with red, gray, blue, yellow, and light gray representing oxygen, nitrogen, sulphur, and carbon, respectively. The hydrogen bonds are shown in green dotted lines and ligand with green stick.
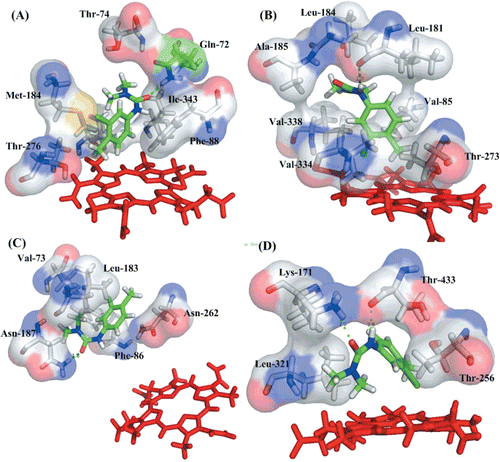
Table 3. Interaction energies of four complexes with substrate (kcal/mol).
Table 4. Energy contribution of key residues to the binding energies.