
Figures & data
Scheme 1. 2D molecular structures of GTX3, DZA, BRZ, DCP, and AAZ.
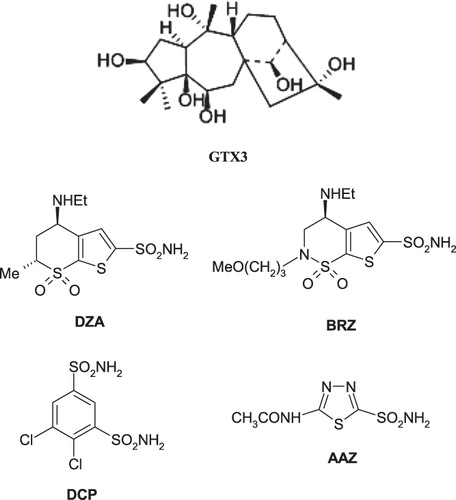
Table 1. Inhibition data of mammalian isoforms hCA I-XIV with grayanotoxin III, and the sulfonamide inhibitor dichlorophenamide DCP (as standard) by a stopped-flow CO2 hydrase assayCitation24.
Figure 1. Binding of grayanotoxin III (GTX3) to hCA I (A) and hCA II (B). The protein backbone is represented with residue position default colors in Maestro, the catalytic Zn(II) ion as the pale brown sphere and GTX3 is shown as stick model (carbon gray, oxygen red, hydrogen white).
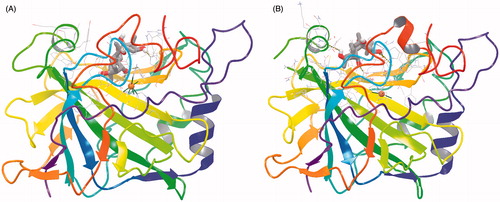
Figure 2. Detailed interactions of grayanotoxin III (GTX3) when bound to the hCA I active site. Docking score at hCA-I: −8.21 kcal/mol (Glide Induced Fit Docking). The protein backbone is represented with residue position default colors in Maestro, the catalytic Zn(II) ion as the pale brown sphere and GTX3 is shown as stick model (carbon gray, oxygen red, hydrogen white). Amino acid residues and water molecules involved in the interaction with grayanotoxin III are also evidenced (CPK colors; hCA I numbering system).
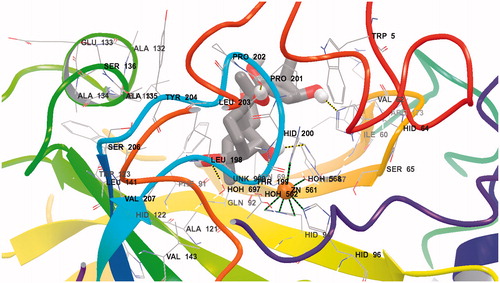
Figure 3. Detailed interactions of grayanotoxin III (GTX3) when bound to the hCA II active site. Docking score at CA-II: −8.29 kcal/mol; (Glide Induced Fit Docking). The protein backbone is represented with residue position default colors in Maestro, the catalytic Zn(II) ion as the pale brown sphere and GTX3 is shown as stick model (carbon gray, oxygen red, hydrogen white). Amino acid residues and water molecules involved in the interaction with grayanotoxin III are also evidenced (CPK colors; hCA I numbering system).
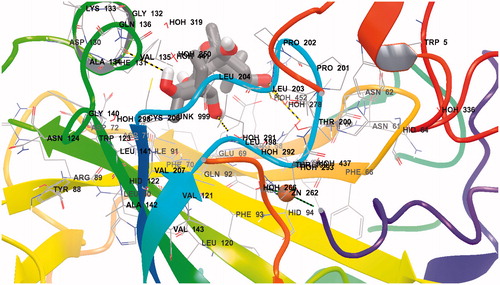
Figure 4. Ligand interaction diagrams for (A) hCA I and (B) hCA II. Residues are labeled and colored according to residue type (green, hydrophobic; cyan, polar; red, negative; purple, positive). Yellow markers on the ligand denote per-atom solvent accessible surface area and marker size shows the amount of exposure. Labeling of residue (font sizes) is used to represent the depth of a residue in the three dimensional view (i.e. “closer” to the viewer are shown in a large font, whereas, residues that are “far away” are shown with small font. While hydrogen bonds to side chains are represented with dashed, hydrogen bonds to backbones are represented as solid lines.
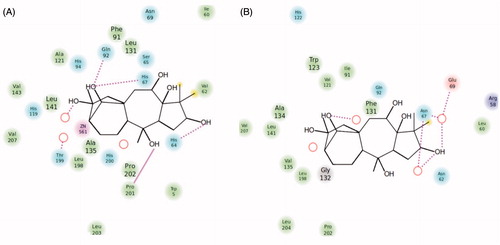
Table 2. Details of molecular docking results of GTX3 within the active sites of hCA I and hCA II using Induced Fit Docking (Glide/XP). Energy units are in kcal/mol.