Figures & data
Figure 1. Sequence alignment of mdN and mdNi. The mitochondrial leader sequence, which is cleaved during protein processing, is hatched. The insertion in mdNi is highlighted in black. The positions of primers used for cloning and PCR analyses are shown as arrows above the sequences. For primers F2 and R2, which introduced restriction sites (see “Materials and methods” section for primer sequences), regions of noncomplementarity to the template sequence are indicated.
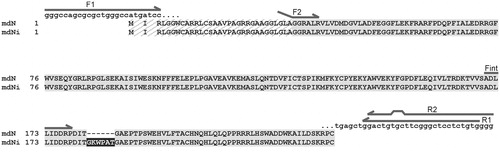
Table 1. Crystal data and diffraction data collection and refinement statistics.
Figure 2. PCR analyses of tissue-specific cDNA libraries with primers encompassing the site of insertion. PCR products were analyzed on a 3% agarose gel: lane 1, brain; lane 2, heart; lane 3, skeletal muscle; + and − denote PCR products obtained from plasmids containing coding sequences of mdNi with (+) or without (−) the 18-nt insertion; S denotes size markers.
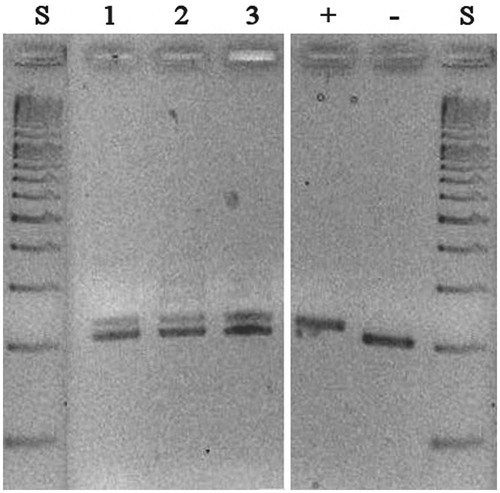
Figure 3. (A) Silver-stained SDS-PAGE of purified recombinant mdN (lane 1) and mdNi (lane 2) with molecular weight standards in kDa (lane S). Each lane contains 3 µg of protein. (B) Thermal unfolding transition of mdN (gray) and mdNi (black) proteins. After reaching the plateau, the fluorescence intensity started to decrease due to denaturation of the protein–dye complex.
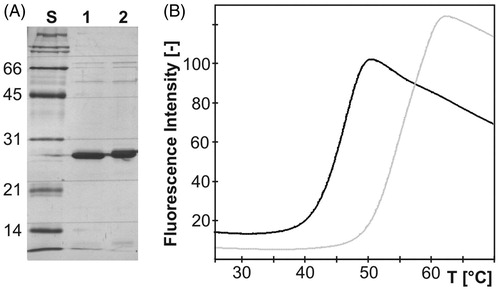
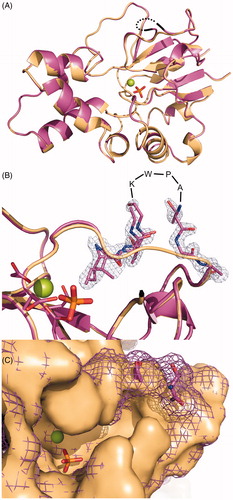
Figure 4. Superposition of the crystal structures of mdN (PDB code 4L6A)Citation17 in light orange and mdNi (PDB code 4MUM) in deep purple. Magnesium and phosphate ions bound in the active site are shown in sphere and stick representations, respectively. (A) View of the overall structures. The partially disordered insertion is represented with a black dotted line. (B) Details of the mdNi insert region with 2Fo − Fc electron density map contoured at 1.0 σ. Residues missing in the crystallographic model are indicated. Catalytic residues (D41, D43, D176, D177) are shown in sticks. (C) Surface representation of the active site. mdN is presented as a solid surface, while the surface of mdNi is shown as mesh.