
Figures & data
Figure 1. Structures of phenothiazine derivatives: neuroleptic drugs, MTC and other selective BuChE inhibitors.
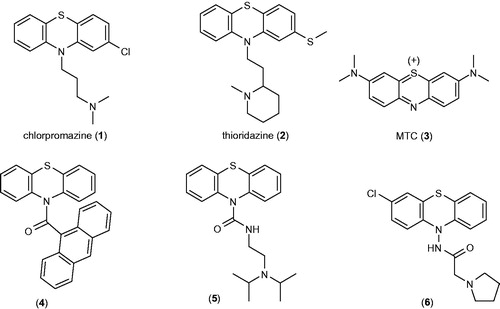
Table 1. Details of the target preparation and docking settings for the selected complexes of inhibitors with AChE.
Figure 2. Dose-dependent plot for active BuChE inhibitors 14–18.
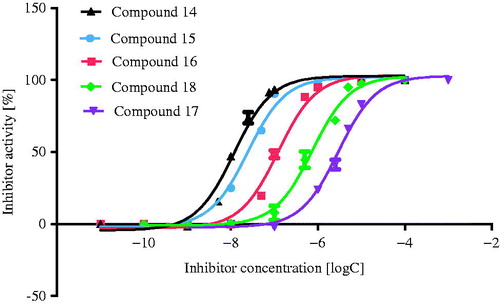
Table 2. Inhibition of AChEa and BuChEb at 10 µmol/L screening concentration by azaphenothiazine derivatives selected by virtual in silico screening.
Table 3. Physicochemical properties of selected, potential cholinesterases inhibitors: MW, Log P (average Log P from ALOGPS 2.1), molecular volume (Mvol from MarvinSketch).
Figure 3. Lineweaver–Burk plots resulting from substrate-velocity curves of BuChE activity of compound 14 in concentration of 10, 25 and 75 nM.
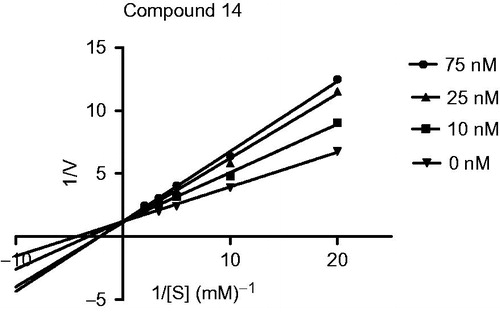
Figure 4. Binding mode of compound 14 in the active site of butyrylcholinesterase. Marked spheres (yellow) show hydrophobic interactions while the arrow (green) indicates a hydrogen bond between the nitrogen atom and the serine 198 amino acid.
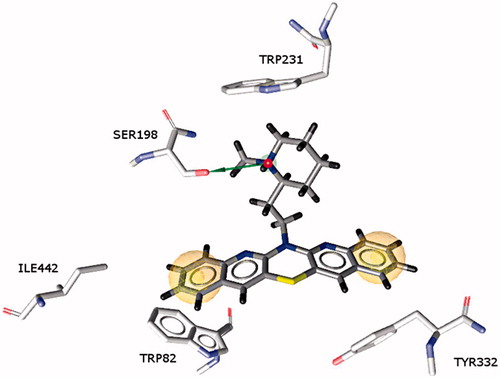
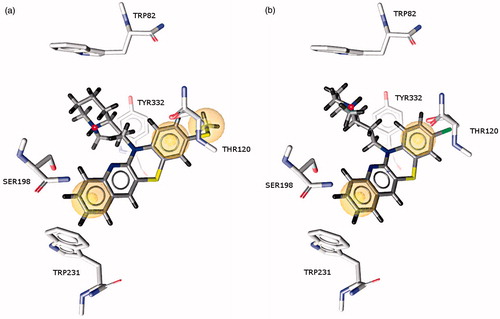
Figure 5. Binding mode of compounds 15 and 16 in the active site of butyrylcholinesterase. Marked spheres (yellow) show hydrophobic interactions. (a) Compound 15 and (b) Compound 16.
Supplemental material