Figures & data
Figure 1. Chemical structures and abbreviations of the CA inhibitors used in this study. Every inhibitor bears a sulfonamide group that binds to the zinc atom of the CA active site.
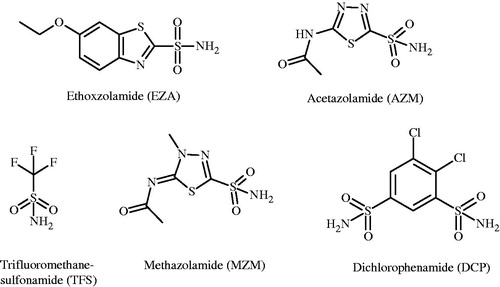
Figure 2. EZA and TFS binding to CA II observed by the FTSA at pH 7.0. (A) and (B) show the protein melting fluorescence curves at several added concentrations of EZA and TFS, respectively. (C) Shows the dependence of the protein melting temperatures Tm on the added compound concentrations. Datapoints are the experimental values obtained from the upper graphs and the solid lines are simulated according to the model as described in the methods.
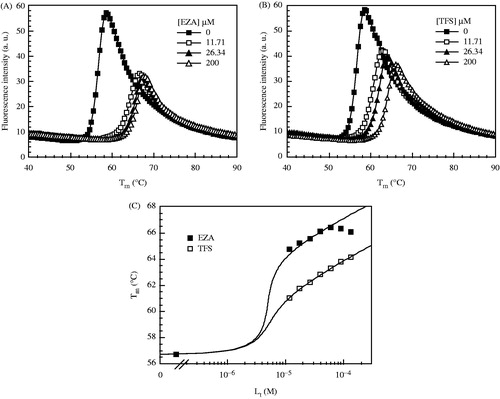
Table 1. The observed thermodynamic parameters of EZA, TFS and AZM binding to CA I and II in phosphate and Tris buffers at various pH, 25°C, determined by ITC.
Figure 3. ITC data shows EZA binding to CA II dependence on buffer solution and pH value at the same temperature (25 °C). Integrated curves show observed data in Tris-chloride buffer at pH 7.0 (filled triangle) and pH 9.0 (filled square) and sodium phosphate buffer at pH 7.0 (open circle). The inset shows raw ITC curve in Tris-chloride buffer, pH 7.0, 25 °C.
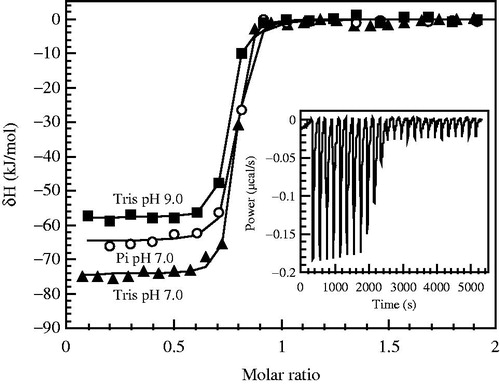
Figure 4. The observed enthalpies of binding are shown as a function of buffer pH. Panel A: CA I-EZA, Panel B: CA I-TFS and Panel C: CA II-EZA. Filled circles show the observed binding enthalpies in sodium phosphate buffer, open circles show binding enthalpies observed in Tris-chloride buffer. Experiments were performed by ITC at 25°C. Dotted line represents the intrinsic binding enthalpy. Curves are fit according to Equation (5).
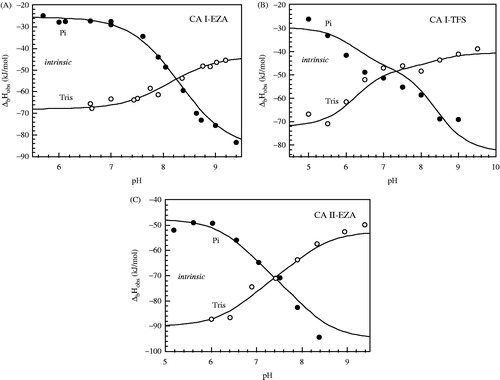
Figure 5. The observed Gibbs free energy (ΔbGobs) of EZA (Panel A) and TFS (Panel B) binding to CA I, and EZA binding to CA II (Panel C) at various pH. TFS binding to CA I was determined by ITC in Tris-chloride (open triangle, Panel B) and sodium phosphate (open diamond) buffers and by FTSA (filled square). EZA binding to CA I and CA II was performed by FTSA (Panels A and C). Solid line shows the fit according to Equation (2) using parameters listed in tables. Dashed and dotted lines show the contributions of deprotonated ligand and protonated CA, respectively. Straight line shows the intrinsic Gibbs free energy of binding.
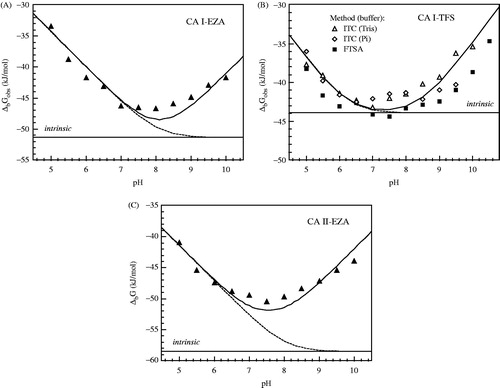
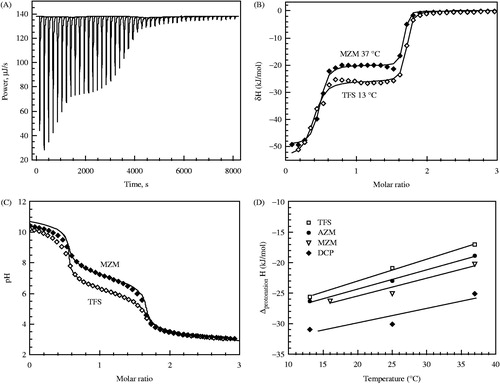
Figure 6. Panel A – representative raw ITC data of alkaline inhibitor (MZM) protonation with HCl at 25°C. About 1.5 equivalents of NaOH were added to the neutral inhibitor solution. Concentrations and volumes used for ITC experiments were identical to pH titration experiments shown in Panel C. First portion of the titration curve represents the reaction between H+ and excess OH−. The second portion of the titration curve having the stoichiometry of 1.0 represents the inhibitor protonation. Solid line is the baseline. Panel B – integrated ITC curves of TFS (open diamond) at 13 °C and MZM (filled diamond) at 37 °C titration with HCl. The enthalpy of the first portion of the titration (stoichiometry ∼0.5, ΔH ∼ −54 kJ/mol) is a value close to the expected value for the reaction of H+ + OH− = H2O. The enthalpy of the second portion of the titration curve (stoichiometry ∼1.0) represents the enthalpy of sulfonamide protonation. Panel C – the pH titration curves for MZM (filled diamond) and TFS (open diamond), determined potentiometrically at 24 °C. Concentrations and volumes were identical to ITC experiments (panels A and B). Two transitions are seen: 0.5 equivalent of H+ reaction with OH−, and one equivalent of sulfonamide protonation. The pKa is approximately equal to the pH at the midpoint of the second stage of the titration. Datapoints are experimental pH values and the line is fit according to another studyCitation24. Panel D – the temperature dependence of inhibitor sulfonamide group protonation (reaction R3 in reverse) enthalpy as determined by ITC. Datapoints are experimentally determined integral enthalpies for, TFS (open square), AZM (filled circle), MZM (inverted open triangle), and DCP (filled diamond). Lines are linear fits of the experimental data. Slopes of the lines are positive and equal to the heat capacities of about 190–290 J × mol−1 K−1.