Figures & data
Figure 1. Sensing cell culture flask (SCCF), a microsensor chip is embedded in the bottom of a conventional tissue culture flask (A), detailed view of the transparent microsensor chip (B) with its electrical contact pads outside the flask.
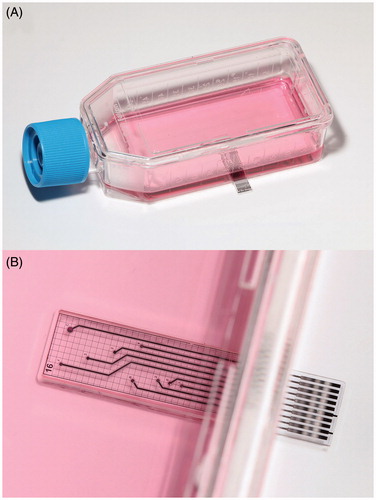
Figure 2. Microphysiometry chip (A). Oxygen and pH are measured in the cell culture area during the stop phase. Glucose and lactate are measured during the flow phase in the outlet microfluidic channel. Photography of microphysiometry chip with cell culture well filled for cell culturing phase (B).
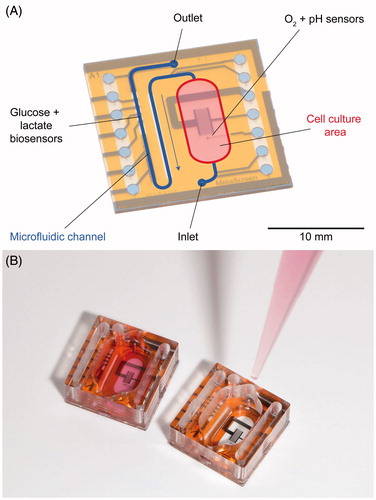
Figure 3. Screenshot of bioMON software client window – exposing glucose and lactate concentration on line traces to the user.
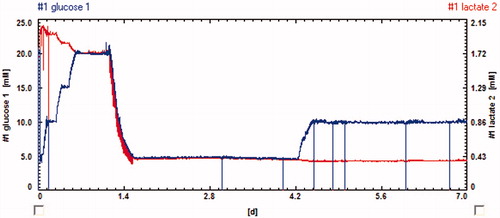
Figure 4. Indicating how the full panel of analytes is controlled by the array of biosensors.
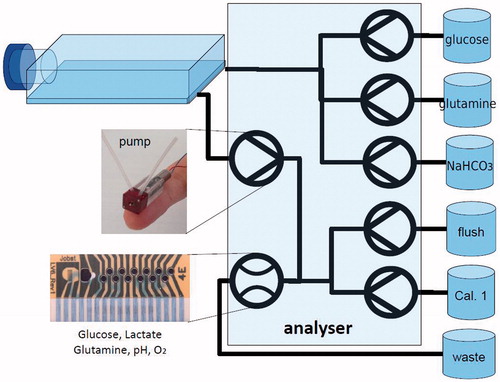
Figure 5. CA-inhibitors reported ultimately, which showed selectivity for the inhibition of the tumour-associated isoforms CAIX and –XII.
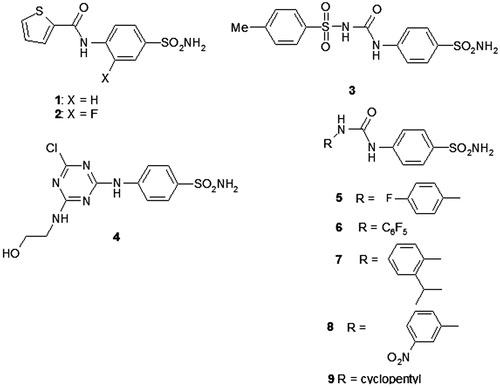
Figure 6. hCA II complexed with the tosylureido benzenesulphonamide 3 (green) and triazinyl-substituted benzenesulphonamide 4 (blue)Citation249 (A); and with five ureido sulphonamides 5–9, compounds 5 (orange), 6 (pink), 7 (yellow), 8 (grey), and 9 (cyan) (B)Citation253.
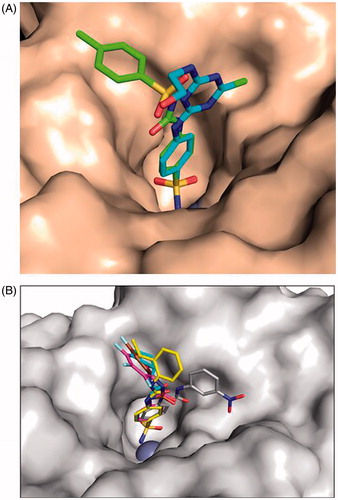
Figure 7. (A) Structure of DTCs 10–12. (B) Electronic density for the adduct of dithiocarbamate 11 bound within the active site of hCA II [i]. The zinc ion is shown as the central sphere and the amino acid residues involved in the binding are evidenced and numbered (hCA I numbering system)Citation255.
![Figure 7. (A) Structure of DTCs 10–12. (B) Electronic density for the adduct of dithiocarbamate 11 bound within the active site of hCA II [i]. The zinc ion is shown as the central sphere and the amino acid residues involved in the binding are evidenced and numbered (hCA I numbering system)Citation255.](/cms/asset/18892b1f-6a83-492a-ac7d-9d2f3ae76036/ienz_a_966704_f0007_b.jpg)
Figure 8. Validation of the common hypoxia signatureCitation342 in different breast cancer subtypes and prognostic utility. (A) Box-whisker plots showing median, upper and lower quartiles and 95% range of hypoxia signature. Breast cancer subtypes were classified by hormonal receptor status (ER−/PgR−/HER2−, HER2−, HER2+, ER−, ER+) or PAM50 (Basal, Her2, LuminalB, LuminalA, Normal-like). (B) Kaplan–Meier analysis of the Metabric cohort demonstrating poorer overall survival for breast cancer patients with relatively higher hypoxia signature score. Patients were divided into quartiles from low (Q1) to high (Q4) hypoxia groups based on cumulative hypoxia score.
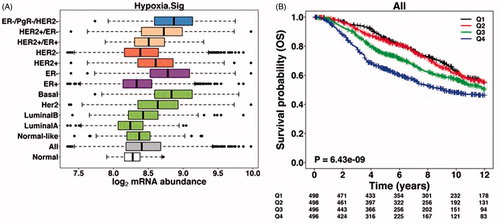
Figure 9. Predictive impact of the 15-gene hypoxia gene signature stratified by HPV status (immunohistochemical detection of p16) on loco-regional control. HPV-negative / “more” hypoxic tumours (A), HPV-negative / “less” hypoxic tumours (B), HPV-positive / “more” hypoxic tumours (C), and HPV-positive / “less” hypoxic tumours (D). Loco-regional tumour control is described with the Kaplan–Meier method, compared using the log-rank test, and also expressed as adjusted hazard ratios (HR) using a multi-variate Cox proportional hazards model with the following parameters included: tumour and nodal classification, gender, and age. Modified from Toustrup et al.Citation362.
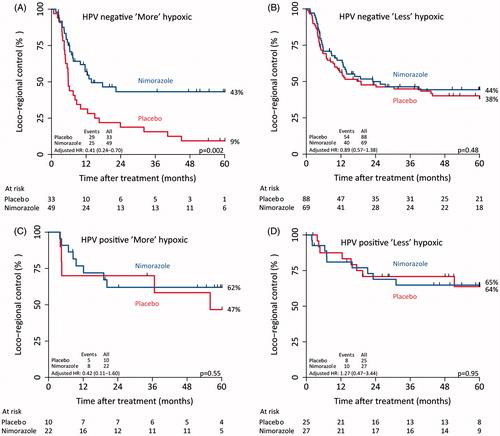
Figure 10. Approach and design of the “window-of-opportunity” phase 2 trial with a hypoxia targeting drug combined with a conventional treatment.
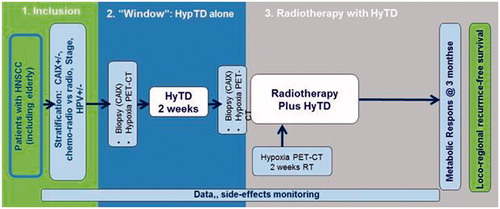
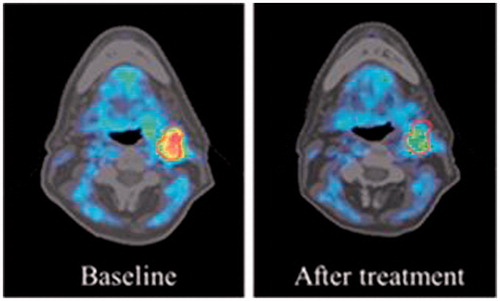
Figure 11. Hypoxia PET before and after hypoxia targeting drug (HyTD).