Figures & data
Figure 1. Synthetic route of newly synthesized componds 4a–h.
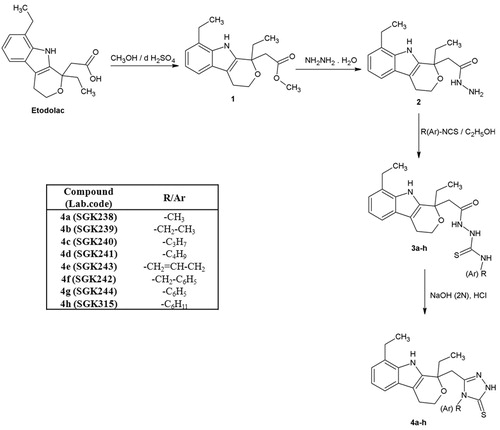
Table 1. The anticancer screening data of etodolac triazoles, 4b and 4f.
Table 2. Anti-HCV NS5B RdRp activity of etodolac derivatives.
Figure 2. Glide-XP predicted binding model of compound (S)-4a within the TP-II of HCV NS5B polymerse. Amino acid residues are shown as stick model with the atoms colored as carbon – green, hydrogen – white, nitrogen – blue oxygen – red and sulfur – yellow whereas inhibitor is shown as ball and stick model with the same color scheme as above except carbon atoms are represented in orange. Water molecules are shown as stick model. Dotted black line indicates hydrogen bonding interaction whereas dotted pink line indicates potential electrostatic contact with distances in Å (please view this figure in color mode in the online version).
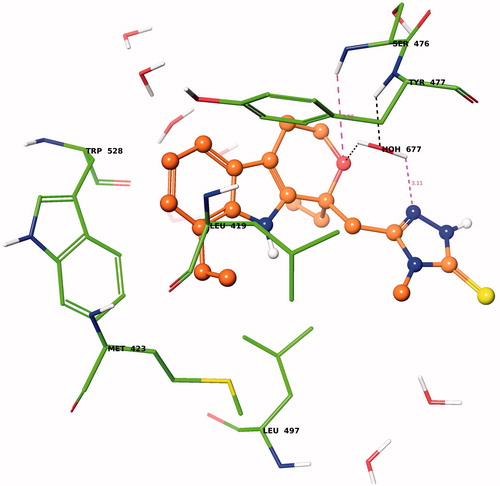
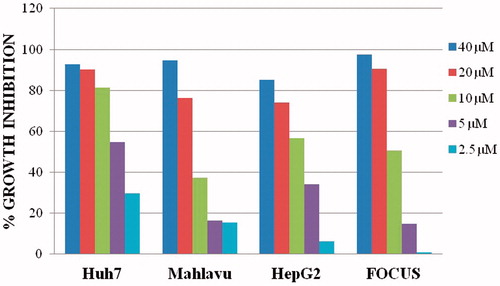
Figure 3. Percent growth inhibition graphs of compound 4a, SGK-238 on liver cancer cell lines (Huh7, Mahlavu, HepG2, FOCUS).