Figures & data
Figure 1. Assay of AChE activity using 2,6-dichloroindophenol acetate hydrolysis to 2,6-dichloroindophenol.
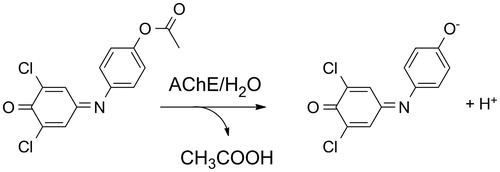
Figure 2. Localization of 2,6-dichloroindophenol acetate (top scored pose: violet = right position for uncolored printing; second top scored pose: yellow in the middle of the picture, left from the top scored pose) in active site of AChE.
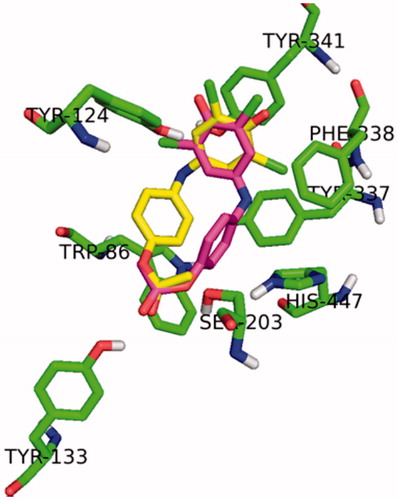
Figure 3. Saturation for human AChE and acetylthiocholine as a substrate. Error bars indicate standard deviations for n = 5.
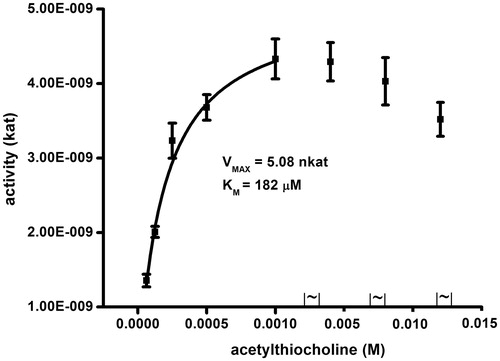
Figure 4. Saturation for human AChE and 2,6-dichlorophenolindophenol acetate as a substrate. Error bars indicate standard deviations for n = 5.
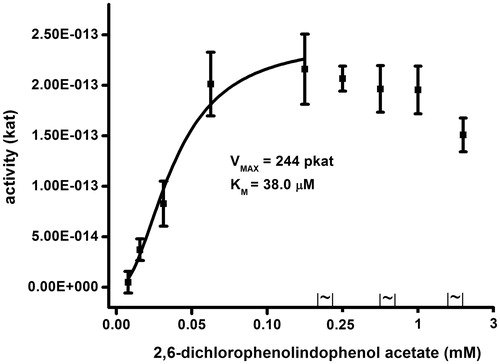
Figure 5. Principle of redox change of 2,6-dichlorphenoindophenol color: blue color (form in the left part) is changed to colorless form because of reduction by, for example, ascorbic acid.
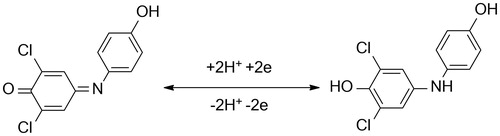
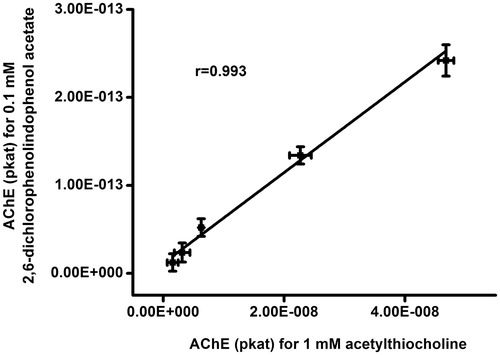
Figure 6. Correlation of AChE activity examination using 2,6-dichlorophenolindophenol acetate and Ellman's method. Error bars indicate standard deviations for n = 5.