Figures & data
Table 1. RMSE comparison between observed binding affinities (pIC50) for 35 CASP3 inhibitors, published by Wang et al.Citation20, and the corresponding binding affinities (pIC50) predicted by the PLSR, SVR, and ANFIS determination of leave-one-out cross-validation for the X-feature vectors of the testing data sets.
Figure 1. (A) X-, (B) Y- and (C) Z-pattern images of CASP3–ligand complexes obtained by sequential floating forward selection, SFFS. Each image has 37 × 37 pixels. Black pixels represent the selected features.
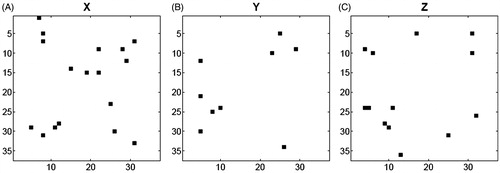
Figure 2. Correlation plots of the observed (x-axis) and predicted (y-axis) binding affinities (pIC50) constructed upon ANFIS determination of leave-one-out cross-validation (LOOCV), using 35 different testing sets selected from the X-feature (A), Y-feature (B), and Z-feature (C) vectors of the CASP3–ligand complexes.
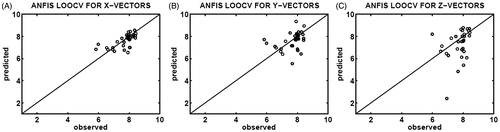
Figure 3. Correlation plots of the observed (x-axis) and predicted (y-axis) binding affinities (pIC50) constructed upon SVR determination of leave-one-out cross-validation (LOOCV), which utilized 35 different testing sets selected from the X-feature (A), Y-feature (B), and Z-feature (C) vectors of the CASP3–ligand complexes.
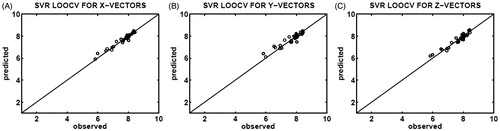
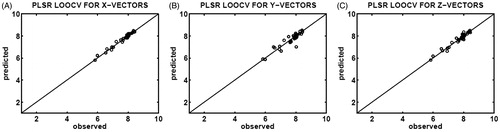
Figure 4. Correlation plots of the observed (x-axis) and predicted (y-axis) binding affinities (pIC50) constructed upon PLSR determination of leave-one-out cross-validation (LOOCV), using 35 different testing sets selected from the X-feature (A), Y-feature (B), and Z-feature (C) vectors of the CASP3–ligand complexes.