Figures & data
Table I. Clinical characteristics of the study population.
Table II. Plasma concentrations of angiogenic factors in normal pregnancy and preterm labor who delivered preterm.
Table III. Unadjusted and adjusted odds ratio for the identification of spontaneous preterm labor by plasma sEng concentrations above the 3rd quartile for various gestational age intervals in pre-clinical samples.
Table IV. Mixed-effect model comparing the profiles of plasma sEng and sVEGFR-1 concentrations in relation to gestational age between patients with PTL and normal pregnant women adjusting for confounders (see text).
Figure 1. Profile of plasma soluble endoglin (sEng) concentrations (ng/ml) in relation to GA in normal pregnant women and patients with spontaneous PTL and delivery. Patients destined to developed PTL had a significantly different profile (plasma concentration over time) of plasma sEng concentration from patients with normal pregnancies after adjusting for GA at blood sampling, maternal age, body mass index, nulliparity, a history of preterm delivery, smoking and duration of sample storage (p = 0.04). Plasma sEng concentration was higher in patients destined to develop PTL than in normal pregnant women from 15 to 20 weeks of gestation. The difference became statistical significance at 27.7 weeks and was more pronounce as delivery approached.
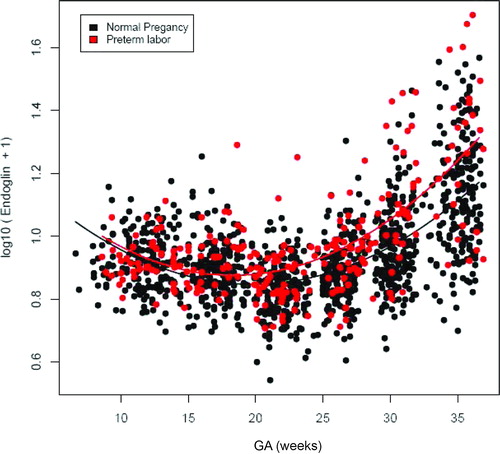
Table V. Mixed-effect model comparing the profiles of plasma PlGF and sVEGFR-2 concentrations in relation to gestational age between patients with PTL and normal pregnant women adjusting for confounders (see text).
Figure 2. Profile of plasma sVEGFR-1 concentrations (pg/ml) in relation to GA in normal pregnant women and patients with spontaneous PTL and delivery. Patients destined to developed PTL had a significantly different profile (plasma concentration over time) of plasma sVEGFR-1 concentration from patients with normal pregnancies after adjusting for GA at blood sampling, maternal age, body mass index, nulliparity, a history of preterm delivery, smoking and duration of sample storage (p = 0.003). Plasma sVEGFR-1 concentrations in patients with PTL were slightly lower than those in normal pregnant women from 10 to 28 weeks of gestation. After this GA, plasma sVEGFR-1 concentrations became higher until delivery.
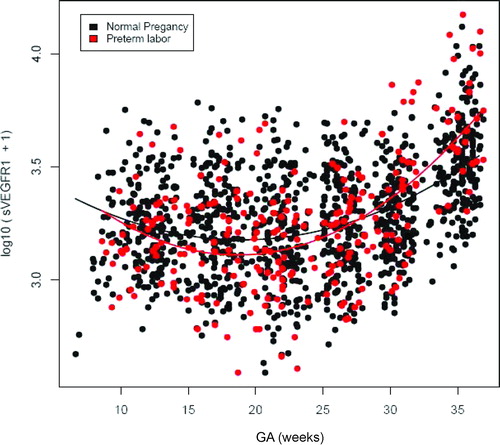
Figure 3. Profile of plasma placenta growth factor (PlGF) concentrations (pg/ml) in relation to GA in normal pregnant women and patients with spontaneous PTL and delivery. There was no significant difference in the profile (plasma concentration over time) of plasma PlGF concentration between patients with PTL and normal pregnant women after adjusting for GA at blood sampling, maternal age, body mass index, nulliparity, a history of preterm delivery, smoking and duration of sample storage (p = 0.3).
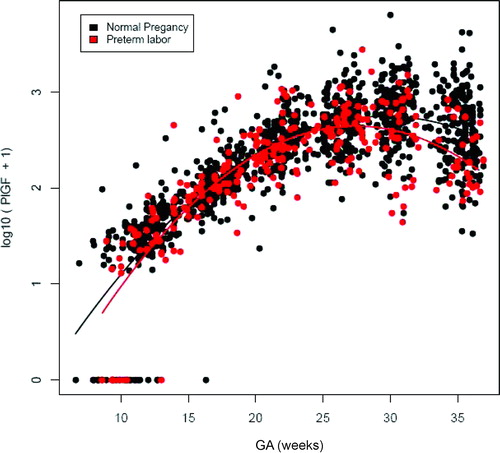
Figure 4. Profile of plasma sVEGFR-2 concentrations (ng/ml) in relation to GA in normal pregnant women and patients with spontaneous PTL and delivery. There was no significant difference in the profile (plasma concentration over time) of plasma sVEGFR-2 concentration between patients with PTL and normal pregnant women after adjusting for GA at blood sampling, maternal age, body mass index, nulliparity, a history of preterm delivery, smoking and duration of sample storage (p = 0.1).
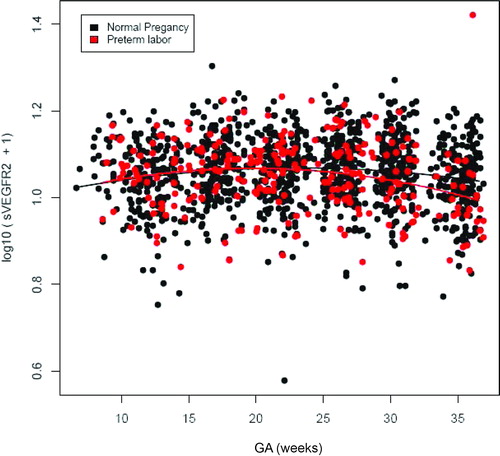
Figure 5. Individual changes in maternal plasma concentration (log 10 (conc+1)) of soluble endoglin (sEng) and soluble vascular endothelial growth factor receptor-2 (sVEGFR-2) in normal pregnant women (control; n = 208) and patients destined to develop PTL and delivery (n = 52) in relation to GA.
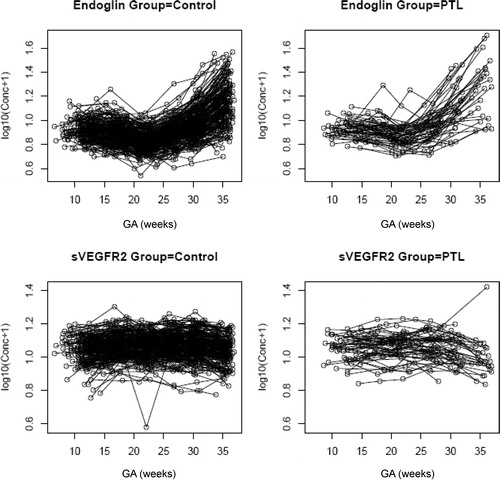
Figure 6. Individual changes in maternal plasma concentration (log10 (conc +1)) of soluble vascular endothelial growth factor receptor-1 (sVEGFR-1) and PlGF in normal pregnant women (control; n = 208) and patients destined to develop PTL and delivery (n = 52) in relation to GA.
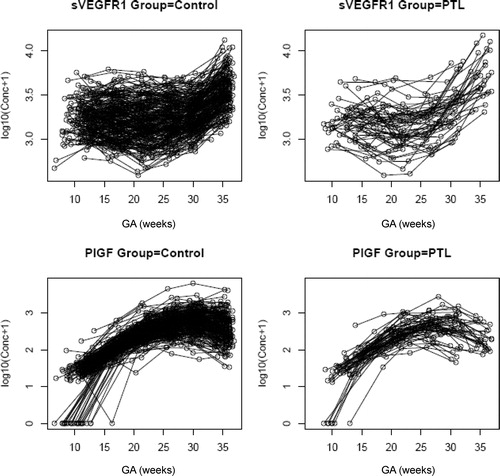
Table VI. Plasma concentrations of angiogenic factors in normal pregnancy and preterm labor who delivered preterm.
Table VII. Proportions of PTL patients who had plasma sEng concentrations above the 3rd quartile stratified by placental pathology.