Figures & data
Figure 1. Diagram of the iTRAQ workflow. The sequence of the workflow is indicated by the arrows in the right side. Pooled reference: Small aliquots from each of the 75 samples of amniotic fluid were pooled to create a reference sample. Deplete-concentrate-reduce-block: The amniotic fluid samples were depleted of albumin and IgG, subsequently concentrated and reduced. Digestion: The samples were subjected to trypsin digestion. Labeling: The reference sample and three individual samples (denoted A, B, and C in the figure) were labeled with iTRAQ reagents (the numbers 114–117 refer to the reporter mass of the individual iTRAQ reagent). Mixing and fractionation: The four labeled samples were mixed and subjected to strong cation exchange (SCX) fractionation to simplify the mixture prior to conducting liquid chromatography and mass spectrometry (LC-MS/MS). Each SCX fraction was subjected to LC-MS/MS. Liquid chromatography: Proteins were separated by liquid chromatography. The retention time is displayed in the horizontal axis. MS1: The first stage of mass spectrometry for a specific retention time is indicated schematically. Each peak in the mass spectrum (horizontal axis is m/z) corresponds to an individual peptide. MS2: A single peak is selected for collisional dissociation and the fragments subjected to a second stage mass spectrometry (tandem MS/MS). The reporter ions from the iTRAQ label appear in the low mass range, distinct from peptide fragment peaks. The pattern of peaks in the final mass spectrum is matched to a database in order to identify the parent peptide. The intensities of the reporter ion peaks indicate the relative abundance of the four samples.
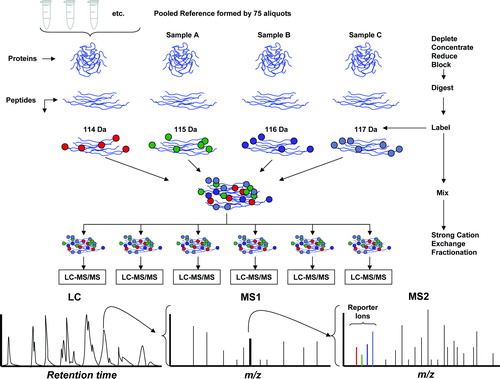
Table I. Demographic and clinical characteristics of patients with spontaneous preterm labor with intact membranes.
Table II. Proteins previously reported in the literature to be differentially up-regulated in the amniotic fluid of patients with IAI.
Table III. Proteins differentially expressed in amniotic fluid samples of patients with preterm delivery with IAI, compared with patients without IAI who delivered at term.
Table IV. Proteins differentially expressed in amniotic fluid samples of patients with preterm delivery without IAI, compared with patients who delivered at term.
Figure 2. A description of the gene ontology biological processes over-represented in the amniotic fluid of women with spontaneous preterm labor in the presence of intra-amniotic infection/inflammation. (A) Pie chart that displays the main four gene ontology terms that were significantly enriched in the amniotic fluid of women with preterm labor with IAI: (1) metabolism/catabolism; (2) mobility, localization and targeting; (3) anti-apoptosis; and (4) host defense. (B) The four main branches in the network diagram represent four gene ontology terms described in the pie chart. Color nodes represent the biological processes that are significantly over-represented (the darker the color, the greater the significance is). The open nodes represent biological processes that did not reach statistical significance. As described in detail in the text, BiNGO (version 2.0) was used to calculate GO term enrichment, and CytoScape (version 2.5.1) was used to visualize the resulting network of GO biological processes.
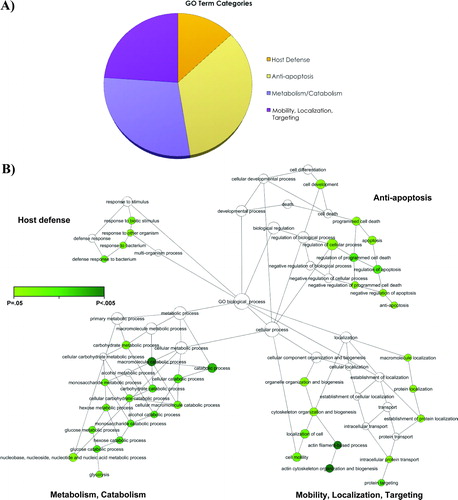
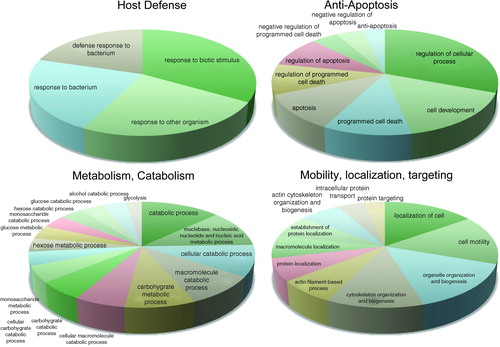
Figure 3. Clusters of biological processes identified in the main four gene ontology terms. The four pie charts represent the main gene ontology terms over-represented in the amniotic fluid of women with spontaneous preterm labor in the presence of intra-amniotic infection/inflammation. Each pie chart displays clusters of biological processes that are significantly enriched and functionally inter-related.