Figures & data
Table I. Demographic and clinical characteristics of the study groups.
Table II. Median (interquartile range) plasma concentrations of sVEGFR-1, sEng, and PlGF in each gestational age interval.
Figure 1. Maternal plasma concentrations (actual data on a loge scale) of soluble vascular endothelial growth factor receptor-1 (sVEGFR-1) in women with a normal pregnancy (ˆ) and patients destined to have a fetal death (•). Each curve represents a quadratic model fit of the concentrations as a function of gestational age in normal pregnant women (dashed line) and those with a fetal death (solid line) without adjusting for covariates. The short vertical lines on the solid curve denote statistical significance between the two groups at the corresponding gestational age according to a linear mixed-effects model adjusting for covariates.
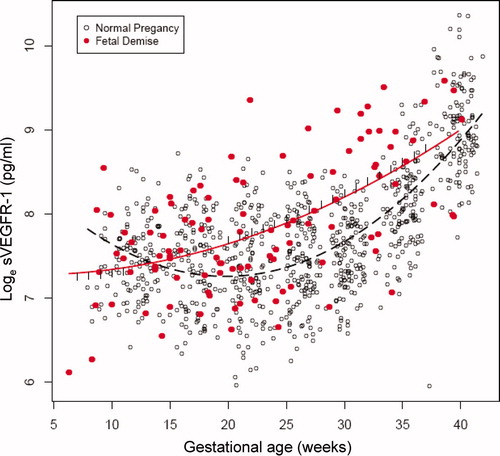
Figure 2. Maternal plasma concentrations (actual data on a loge scale) of soluble endoglin (sEng) in women with a normal pregnancy (ˆ) and patients destined to have a fetal death (•). Each curve represents a quadratic model fit of the concentrations as a function of gestational age in normal pregnant women (dashed line) and those with a fetal death (solid line) without adjusting for covariates. The short vertical lines on the solid curve denote statistical significance between the two groups at the corresponding gestational age according to a linear mixed-effects model adjusting for covariates.
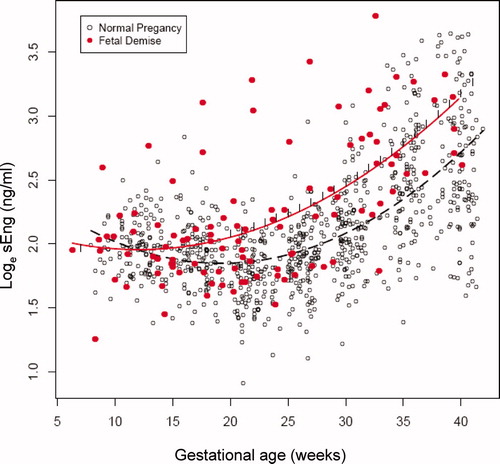
Figure 3. Maternal plasma concentrations (actual data on a loge scale) of placental growth factor (PlGF) in women with a normal pregnancy (ˆ) and patients destined to have a fetal death (•). Each curve represents a quadratic model fit of the concentrations as a function of gestational age in normal pregnant women (dashed line) and those with a fetal death (solid line) without adjusting for covariates. The short vertical lines on the solid curve denote statistical significance between the two groups at the corresponding gestational age according to a linear mixed-effects model adjusting for covariates.
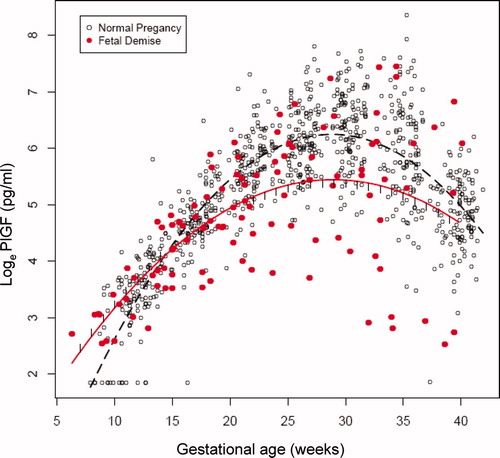
Figure 4. Individual profiles of maternal plasma concentrations (actual data on a loge scale) of sVEGFR-1, sEng and PlGF as a function of gestational age in women destined to have a normal pregnancy (controls) and those destined to have a fetal death.
Table III. Longitudinal analysis of the association between anti-angiogenic (sVEGFR-1 and sEng) or angiogenic factor (PIGF) and fetal death after adjusting for confounding factors.
Table IV. The statistical differences (p) and percentage changes [(fetal death − control)/control × 100] in the maternal plasma concentrations of angiogenic and anti-angiogenic factors between patients with a fetal death and normal pregnant women according to gestational age.
Table V. The statistical differences (p) and percentage changes [(fetal death − control)/control × 100] in the ratio of maternal plasma concentrations of angiogenic and anti-angiogenic factors between patients with a fetal death and normal pregnant women according to gestational age.
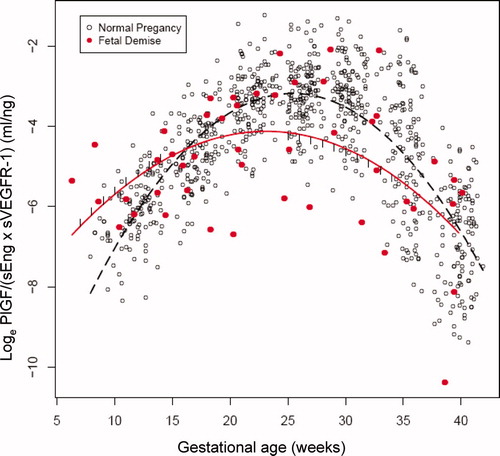
Figure 5. The ratio (loge scale) of maternal plasma concentrations of PlGF/(sEng × sVEGFR-1) in women with a normal pregnancy (ˆ) and patients destined to have a fetal death (•). Each curve represents a quadratic model fit of the concentrations as a function of gestational age in normal pregnant women (dashed line) and those with a fetal death (solid line) without adjusting for covariates. The short vertical lines on the solid curve denote statistical significance between the two groups at the corresponding gestational age according to a linear mixed-effects model adjusting for covariates.
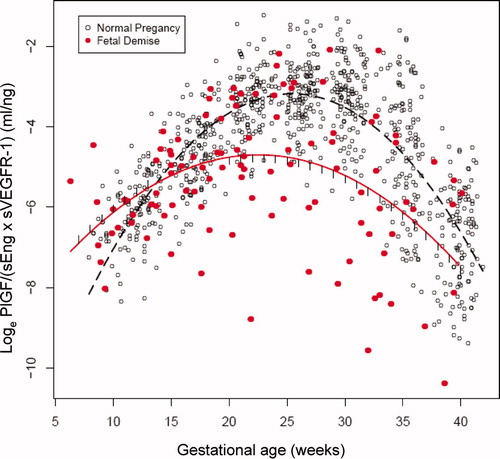
Table VI. The statistical differences (p) and percentage changes [(fetal death − control)/control ×100] in the ratio of maternal plasma concentrations of angiogenic and anti-angiogenic factors [PlGF/ (sVEGFR-1 × sEng)] between patients with a fetal death and normal pregnant women stratified by gestational age at which fetal death was diagnosed.
Figure 6. The ratio (loge scale) of maternal plasma concentrations of PlGF/(sEng × sVEGFR-1) in women with a normal pregnancy (ˆ) and patients destined to have a fetal death before 37 weeks of gestation (•). Each curve represents a quadratic model fit of the concentrations as a function of gestational age in normal pregnant women (dashed line) and those with a fetal death (solid line) without adjusting for covariates. The short vertical lines on the solid curve denote statistical significance between the two groups at the corresponding gestational age according to a linear mixed-effects model adjusting for covariates.
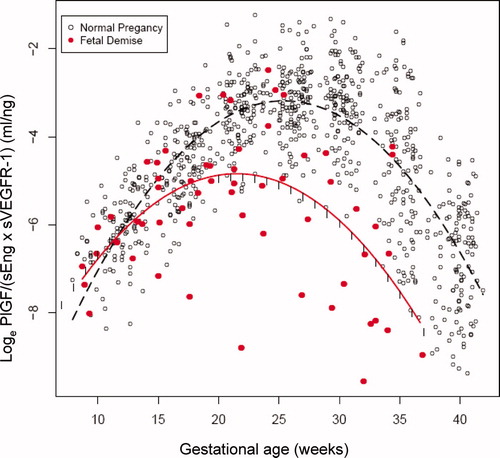
Figure 7. The ratio (loge scale) of maternal plasma concentrations of PlGF/(sEng × sVEGFR-1) in women with a normal pregnancy (ˆ) and patients destined to have a fetal death after 37 weeks of gestation (•). Each curve represents a quadratic model fit of the concentrations as a function of gestational age in normal pregnant women (dashed line) and those with a fetal death (solid line) without adjusting for covariates. The short vertical lines on the solid curve denote statistical significance between the two groups at the corresponding gestational age according to a linear mixed-effects model adjusting for covariates.