1,263
Views
24
CrossRef citations to date
0
Altmetric
Original Article

The relationship of newborn adiposity to fetal growth outcome based on birth weight or the modified neonatal growth assessment score

, , , , &
Pages 1933-1940 | Received 02 Oct 2011, Accepted 02 Apr 2012, Published online: 29 May 2012

Figures & data

Figure 1.  Equations used for neonatal growth assessment score. WT, weight; HC, head circumference; AC, abdominal circumference; ThC, mid-thigh circumference; CHL, crown–heel length [Citation19,Citation20,Citation39].

Figure 1.  Equations used for neonatal growth assessment score. WT, weight; HC, head circumference; AC, abdominal circumference; ThC, mid-thigh circumference; CHL, crown–heel length [Citation19,Citation20,Citation39].

Table I.  Percentage body fat and fat mass percentiles by post-menstrual age (n = 324).

Figure 2.  Body fat versus post-menstrual age expressed as percentage (a) or absolute amount (b) of body fat. Regression equation for percentage body fat = −15.9 + 0.675 × weeks, r2 = 0.075, p < 0.001; for fat mass = −1270 + 41.6 × weeks, r2 = 0.152, p < 0.001. Regression lines = predicted mean value with 5th and 95th percentiles. While the standard deviation in percentage body fat did not significantly change as post-menstrual age increased, the standard deviation in fat mass increased with increasing post-menstrual age. SGA, small for gestational age; AGA, appropriate for gestational age; LGA, large for gestational age.
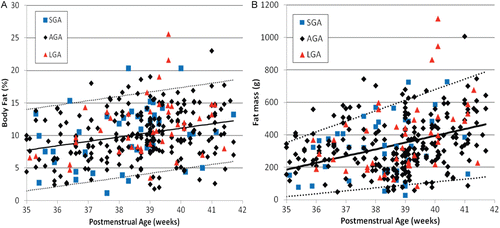
Figure 2.  Body fat versus post-menstrual age expressed as percentage (a) or absolute amount (b) of body fat. Regression equation for percentage body fat = −15.9 + 0.675 × weeks, r2 = 0.075, p < 0.001; for fat mass = −1270 + 41.6 × weeks, r2 = 0.152, p < 0.001. Regression lines = predicted mean value with 5th and 95th percentiles. While the standard deviation in percentage body fat did not significantly change as post-menstrual age increased, the standard deviation in fat mass increased with increasing post-menstrual age. SGA, small for gestational age; AGA, appropriate for gestational age; LGA, large for gestational age.
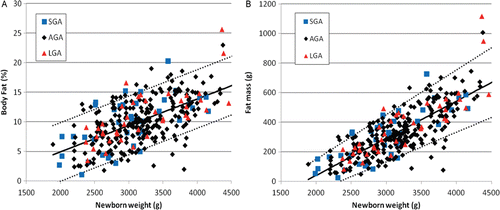
Figure 3.  Body fat versus neonatal weight at the time of air displacement plethysmography expressed as percentage (a) or absolute amount (b) of body fat. Regression equation for percentage body fat = −4.01 + 0.00447 × weight, r2 = 0.370, p < 0.001; for fat mass = −461 + 0.251 × weight, r2 = 0.623, p < 0.0001. Regression lines = predicted mean value with 5th and 95th percentiles. While the standard deviation in percentage body fat did not significantly change as newborn weight increased, the standard deviation in fat mass increased with larger newborn weight. SGA, small for gestational age; AGA, appropriate for gestational age; LGA, large for gestational age.

Figure 3.  Body fat versus neonatal weight at the time of air displacement plethysmography expressed as percentage (a) or absolute amount (b) of body fat. Regression equation for percentage body fat = −4.01 + 0.00447 × weight, r2 = 0.370, p < 0.001; for fat mass = −461 + 0.251 × weight, r2 = 0.623, p < 0.0001. Regression lines = predicted mean value with 5th and 95th percentiles. While the standard deviation in percentage body fat did not significantly change as newborn weight increased, the standard deviation in fat mass increased with larger newborn weight. SGA, small for gestational age; AGA, appropriate for gestational age; LGA, large for gestational age.

Figure 4.  Effect of gender on percentage body fat (%BF) and fat mass. Females had slightly greater mean %BF (10.8 ± 4.2%) when compared to male neonates (9.5 ± 3.6%) (t-test = 2.98, p = 0.003) (a). These differences disappeared when mean fat mass was compared between females (351 ± 183 g) and males (323 ± 161 g) (t-test = 1.47, p = 0.14) (b). On average, males had 2.3 ± 0.34% less %BF (t = 6.78, p < 0.0001) and 78 ± 11 g less FM than females (t = 6.94, p < 0.0001). Both graphs show mean ± 1 SD for each group.
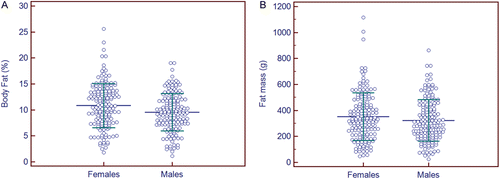
Figure 4.  Effect of gender on percentage body fat (%BF) and fat mass. Females had slightly greater mean %BF (10.8 ± 4.2%) when compared to male neonates (9.5 ± 3.6%) (t-test = 2.98, p = 0.003) (a). These differences disappeared when mean fat mass was compared between females (351 ± 183 g) and males (323 ± 161 g) (t-test = 1.47, p = 0.14) (b). On average, males had 2.3 ± 0.34% less %BF (t = 6.78, p < 0.0001) and 78 ± 11 g less FM than females (t = 6.94, p < 0.0001). Both graphs show mean ± 1 SD for each group.

Figure 5.  Nutritional classification of percentage body fat and fat mass using population-based weight standards. No significant differences were found between groups by either percentage body fat (a), (ANOVA, F ratio = 0.37, p = 0.69), or fat mass (b), (ANOVA, F ratio = 0.14, p = 0.87); similarly, all pairwise comparisons were not significant. Mean values ± 1 SD. SGA, small for gestational age; AGA, appropriate for gestational age; LGA, large for gestational age.
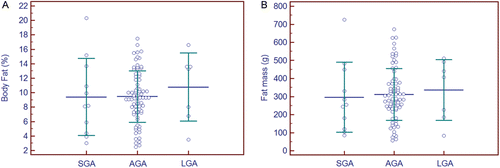
Figure 5.  Nutritional classification of percentage body fat and fat mass using population-based weight standards. No significant differences were found between groups by either percentage body fat (a), (ANOVA, F ratio = 0.37, p = 0.69), or fat mass (b), (ANOVA, F ratio = 0.14, p = 0.87); similarly, all pairwise comparisons were not significant. Mean values ± 1 SD. SGA, small for gestational age; AGA, appropriate for gestational age; LGA, large for gestational age.

Figure 6.  Nutritional classification of percentage body fat and fat mass using a neonatal growth assessment score (m3NGAS51). The same subset of 92 neonates from is stratified into different nutritional groups: intrauterine growth retardation (IUGR, n = 7), normal (n = 81) or macrosomia (n = 4). Significant differences were observed for both percentage body fat (a), F ratio = 7.85, p < 0.005, and fat mass (b) (ANOVA, F ratio = 11.9), p < 0.001. Mean value ± 1 SD are shown; all pairwise comparisons were significant at p < 0.05. SGA, small for gestational age; AGA, appropriate for gestational age; LGA, large for gestational age.

Figure 6.  Nutritional classification of percentage body fat and fat mass using a neonatal growth assessment score (m3NGAS51). The same subset of 92 neonates from Figure 5 is stratified into different nutritional groups: intrauterine growth retardation (IUGR, n = 7), normal (n = 81) or macrosomia (n = 4). Significant differences were observed for both percentage body fat (a), F ratio = 7.85, p < 0.005, and fat mass (b) (ANOVA, F ratio = 11.9), p < 0.001. Mean value ± 1 SD are shown; all pairwise comparisons were significant at p < 0.05. SGA, small for gestational age; AGA, appropriate for gestational age; LGA, large for gestational age.

Table II.  Neonatal nutritional classification: comparison between population standard versus modified neonatal growth assessment score (m3NGAS51)

Table III.  Newborn infant body composition-total body fat stores

Supplemental material

Supplementary Material

Download PDF (75.3 KB)

Reprints and Corporate Permissions

Please note: Selecting permissions does not provide access to the full text of the article, please see our help page How do I view content?

To request a reprint or corporate permissions for this article, please click on the relevant link below:

Academic Permissions

Please note: Selecting permissions does not provide access to the full text of the article, please see our help page How do I view content?

Obtain permissions instantly via Rightslink by clicking on the button below:

If you are unable to obtain permissions via Rightslink, please complete and submit this Permissions form. For more information, please visit our Permissions help page.