Figures & data
Table 1. Clinical characteristics of the study population.
Table 2. Clinical characteristics of patients with preeclampsia (n = 106).
Figure 1. Plasma concentrations of sST2 sub-classified according to gestational age at the diagnosis of preeclampsia. The median plasma concentration of sST2 in women with preeclampsia was significantly higher than in those with uncomplicated pregnancies (≤34 weeks, median 93 ng/mL, interquartile range (IQR) 48.4–159.3 ng/mL versus median 12.7 ng/mL, IQR10.6–20; p < 0.0001; between >34 and <37 weeks, median 62.4 ng/mL, IQR 39.8–101.3 ng/mL versus median 22.5 ng/mL, IQR 12.2–32.5 ng/mL; p < 0.0001; and ≥37 weeks, median 73.1 ng/mL, IQR 51–101.7 ng/mL versus median 49 ng/mL, IQR 35.1–73.4 ng/mL; p ≤ 0.027). The magnitude of the difference was more pronounced in earlier gestation than at term. However, no differences were observed in plasma concentrations of sST2 in women with preeclampsia stratified by gestational age at diagnosis (p = 0.87). The y axis is presented in log 2 scale.
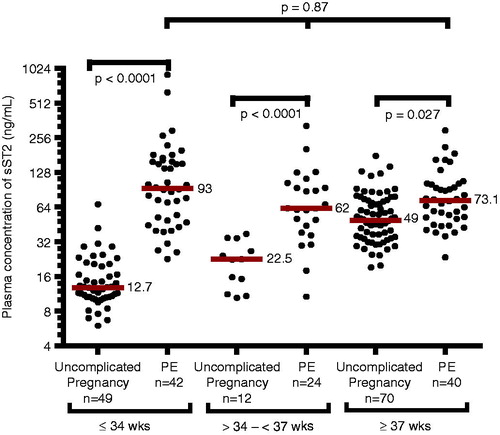
Figure 2. Relationship between gestational age at venipuncture (weeks) and plasma concentrations of sST2 (ng/mL) in women with uncomplicated pregnancies (ˆ; Spearman’s Rho = 0.77, p < 0.0001) and those with preeclampsia (•; Spearman’s Rho = −0.09, p = 0.38). The y axis is presented in log 2 scale.
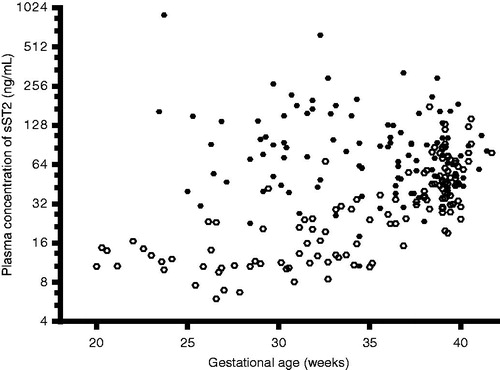
Figure 3. Plasma concentrations of sST2 in uncomplicated pregnancies and patients with preeclampsia sub-classified according to the results of uterine (Ut) and umbilical (Umb) artery Doppler velocimetry. When compared to women with uncomplicated pregnancies, each sub-group of preeclampsia had a significantly higher median plasma concentration of sST2 (Kruskal–Wallis test p < 0.0001). There was no significant difference in the median plasma concentration of sST2 among each subgroup of preeclampsia (Kruskal–Wallis test p = 0.93). The y axis is presented in log 2 scale.
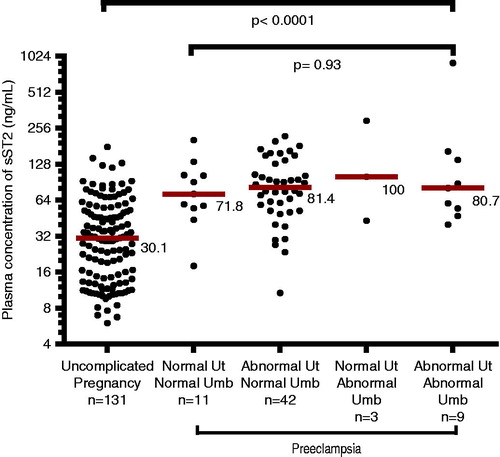
Table 3. Plasma concentrations of angiogenic and anti-angiogenic factors in women with uncomplicated pregnancies and patients with preeclampsia.
Table 4. Correlation between sST2, IL-33 and angiogenic/anti-angiogenic factors.
Table 5. Area under the ROC curves (AUC) achieved by sST2 and angiogenic/anti-angiogenic factors (adjusted for clinical factors) in identifying women with preeclampsia at the time of diagnosis.
Figure 4. Receiver operating characteristic (ROC) curves of plasma sST2 concentrations, each angiogenic/anti-angiogenic factor and their ratios (adjusted for clinical factors) for the identification of women with preeclampsia at the time of diagnosis. Area under the ROC curve for each analyte was also presented (sST2 = 0.86, PlGF = 0.96, sEng = 0.94, sVEGFR1 = 0.97, PlGF/sVEGFR1 = 0.98, and PlGF/sEng = 0.97).
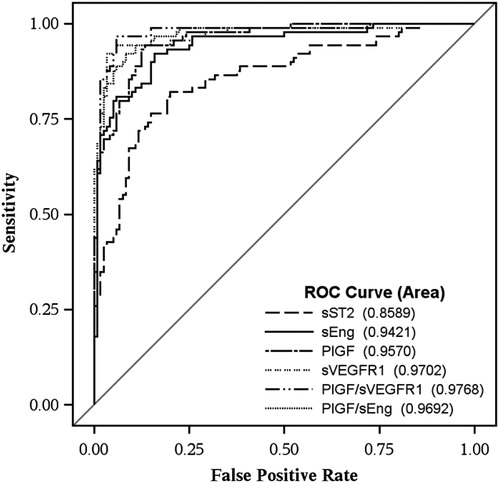
Table 6. Area under the ROC curves (AUC) for sST2 and angiogenic/anti-angiogenic factors (without adjustment for clinical factors) sub-classified according to gestational age at the diagnosis of preeclampsia.